This special page shows all uploaded files.
| Date | Name | Thumbnail | Size | User | Description |
|---|---|---|---|---|---|
| 06:02, 26 May 2026 | Heliumatom-195911445ad.webp (file) | 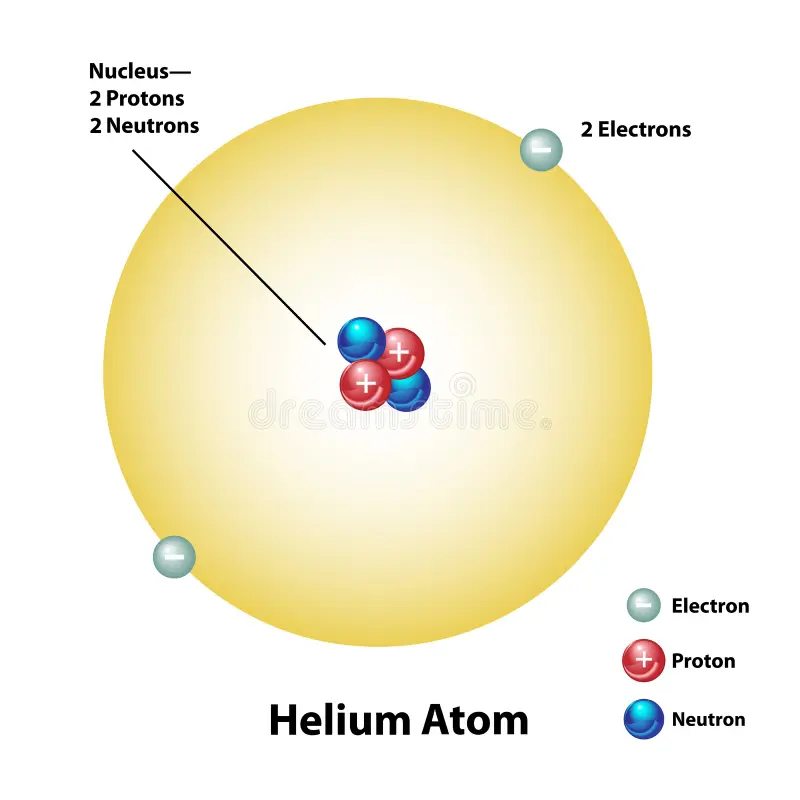 |
16 KB | Kaliambos23 (talk | contribs) | |
| 04:58, 8 March 2026 | Imagehdfh.png (file) |  |
2.85 MB | Kaliambos23 (talk | contribs) | |
| 21:32, 27 February 2026 | Image3242.png (file) |  |
123 KB | Kaliambos23 (talk | contribs) | |
| 20:23, 22 January 2026 | Image757.png (file) |  |
24 KB | Kaliambos23 (talk | contribs) | |
| 01:05, 2 November 2025 | Stokes patch.svg (file) |  |
2 KB | Granpa (talk | contribs) | |
| 04:24, 21 December 2024 | No.png (file) |  |
72 KB | AAAEEUU (talk | contribs) | |
| 17:44, 18 November 2024 | Bosons-Hadrons-Fermions-RGB-png2.png (file) | 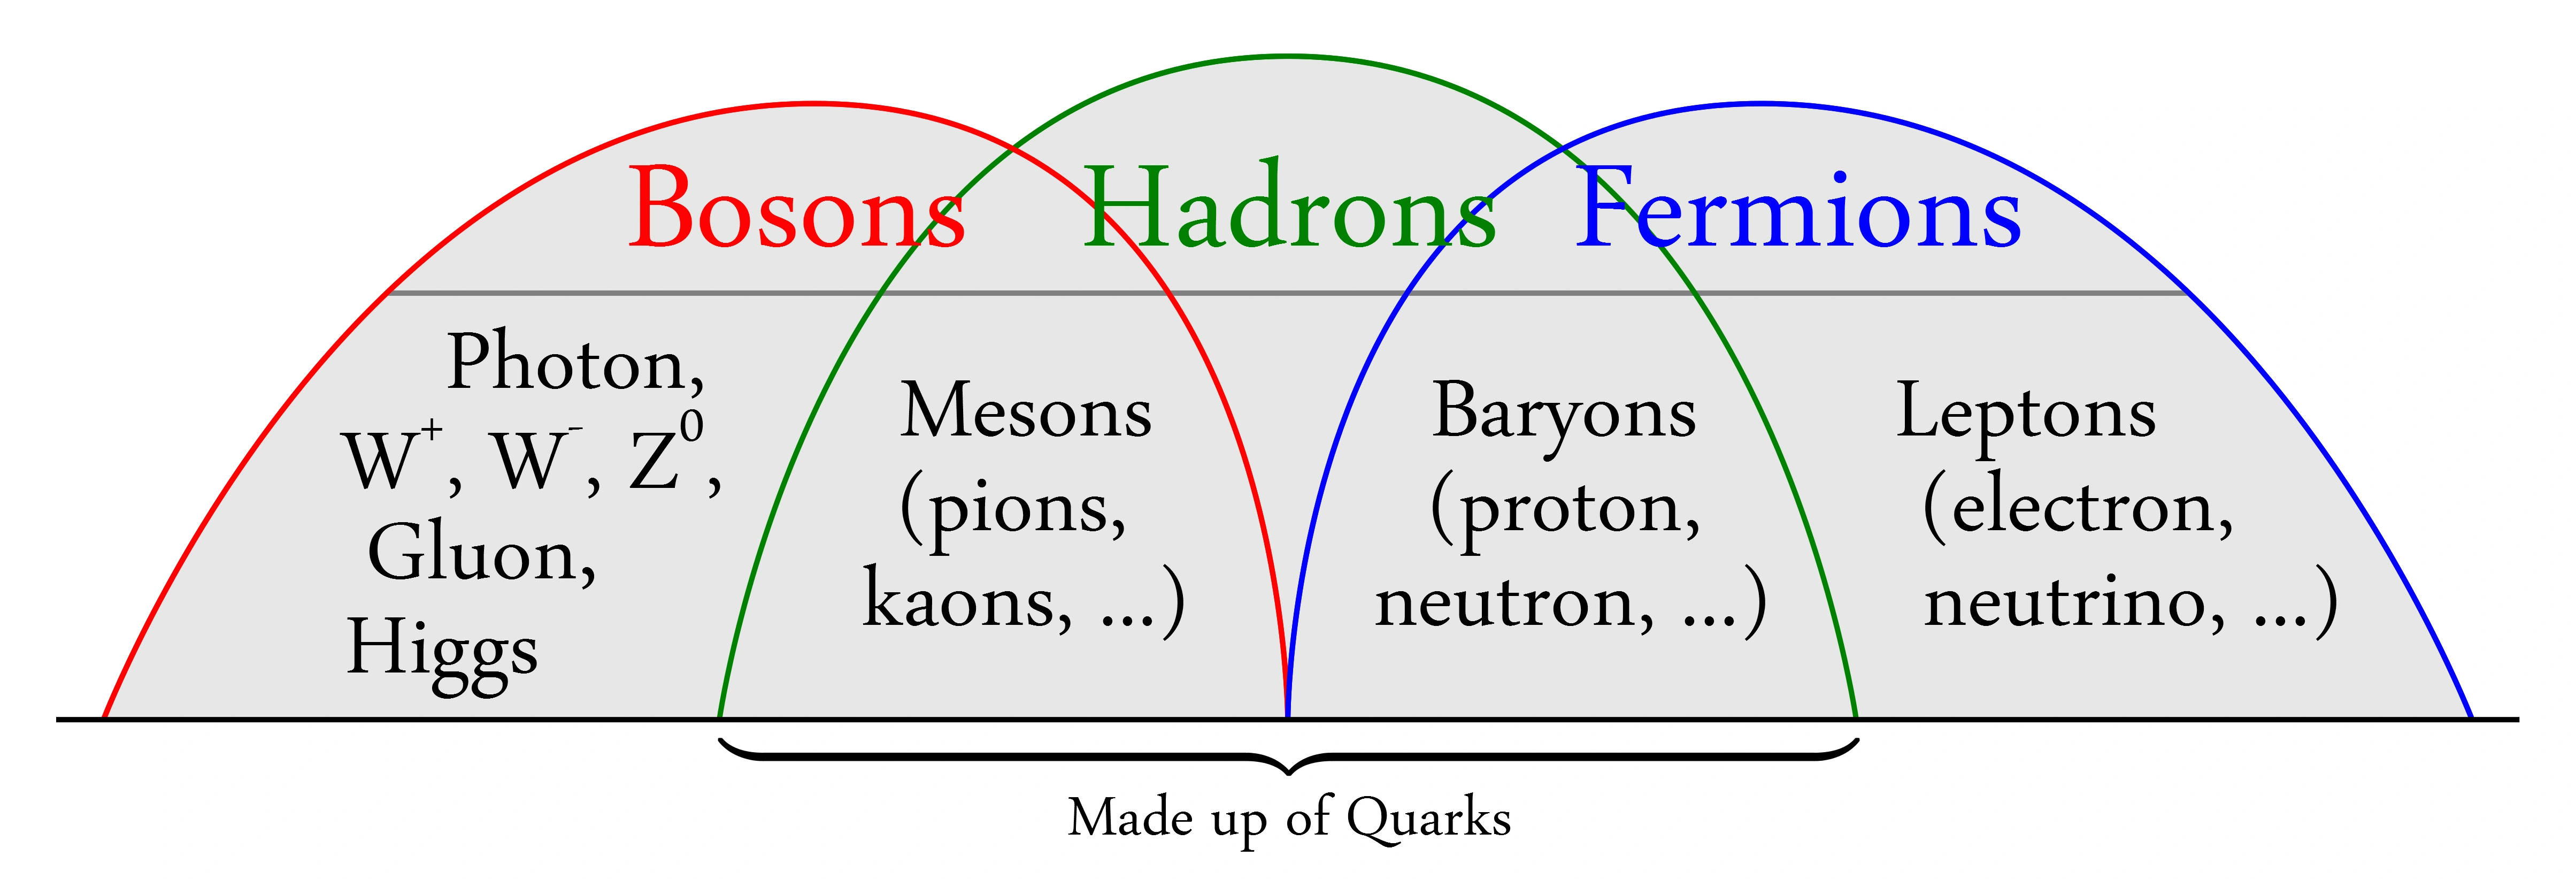 |
277 KB | LunaMeiou (talk | contribs) | |
| 16:32, 16 November 2024 | D3-brane et D2-brane.PNG (file) |  |
317 KB | LunaMeiou (talk | contribs) | |
| 15:58, 14 September 2024 | Josh-habka-spaceCOM-space-foundation.jpg (file) | 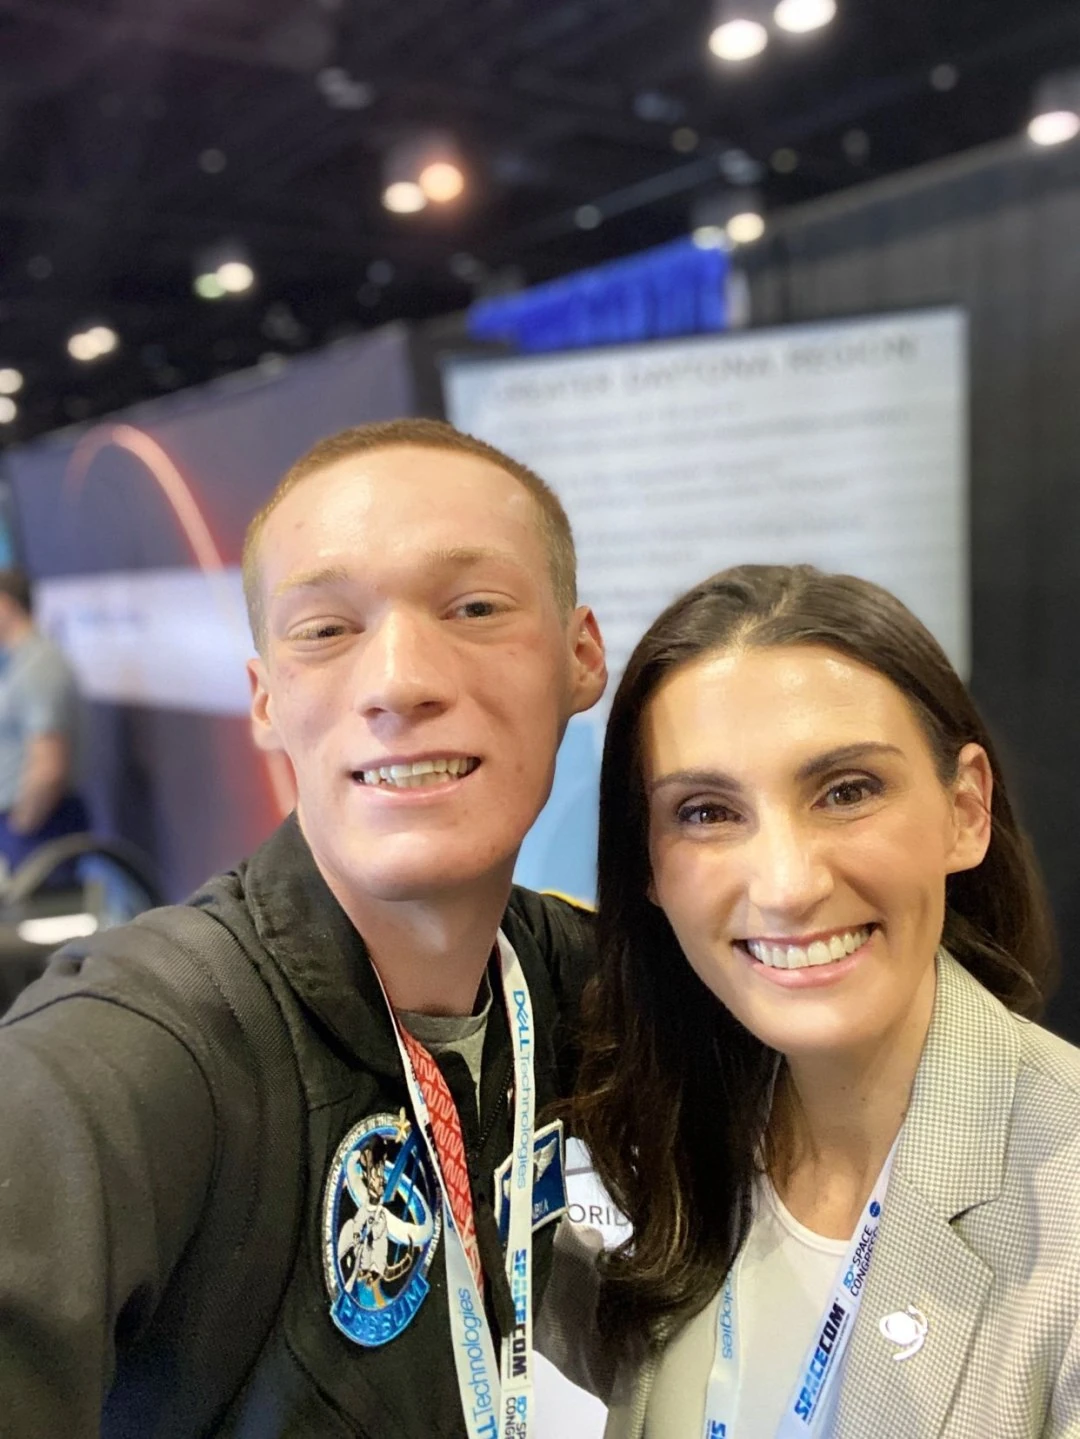 |
227 KB | StructuredWookie (talk | contribs) | Josh Habka with Kelli Kedis Ogborn at SpaceCOM 2024. |
| 22:29, 26 February 2024 | Quantum atom image.jpg (file) | 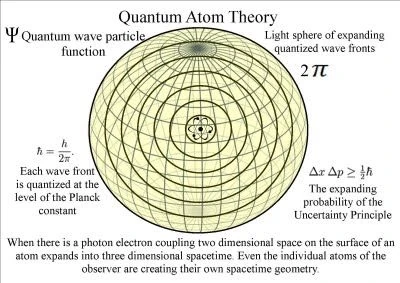 |
33 KB | Cabenshire fr (talk | contribs) | |
| 19:12, 26 February 2024 | Bohr Theory.png (file) | 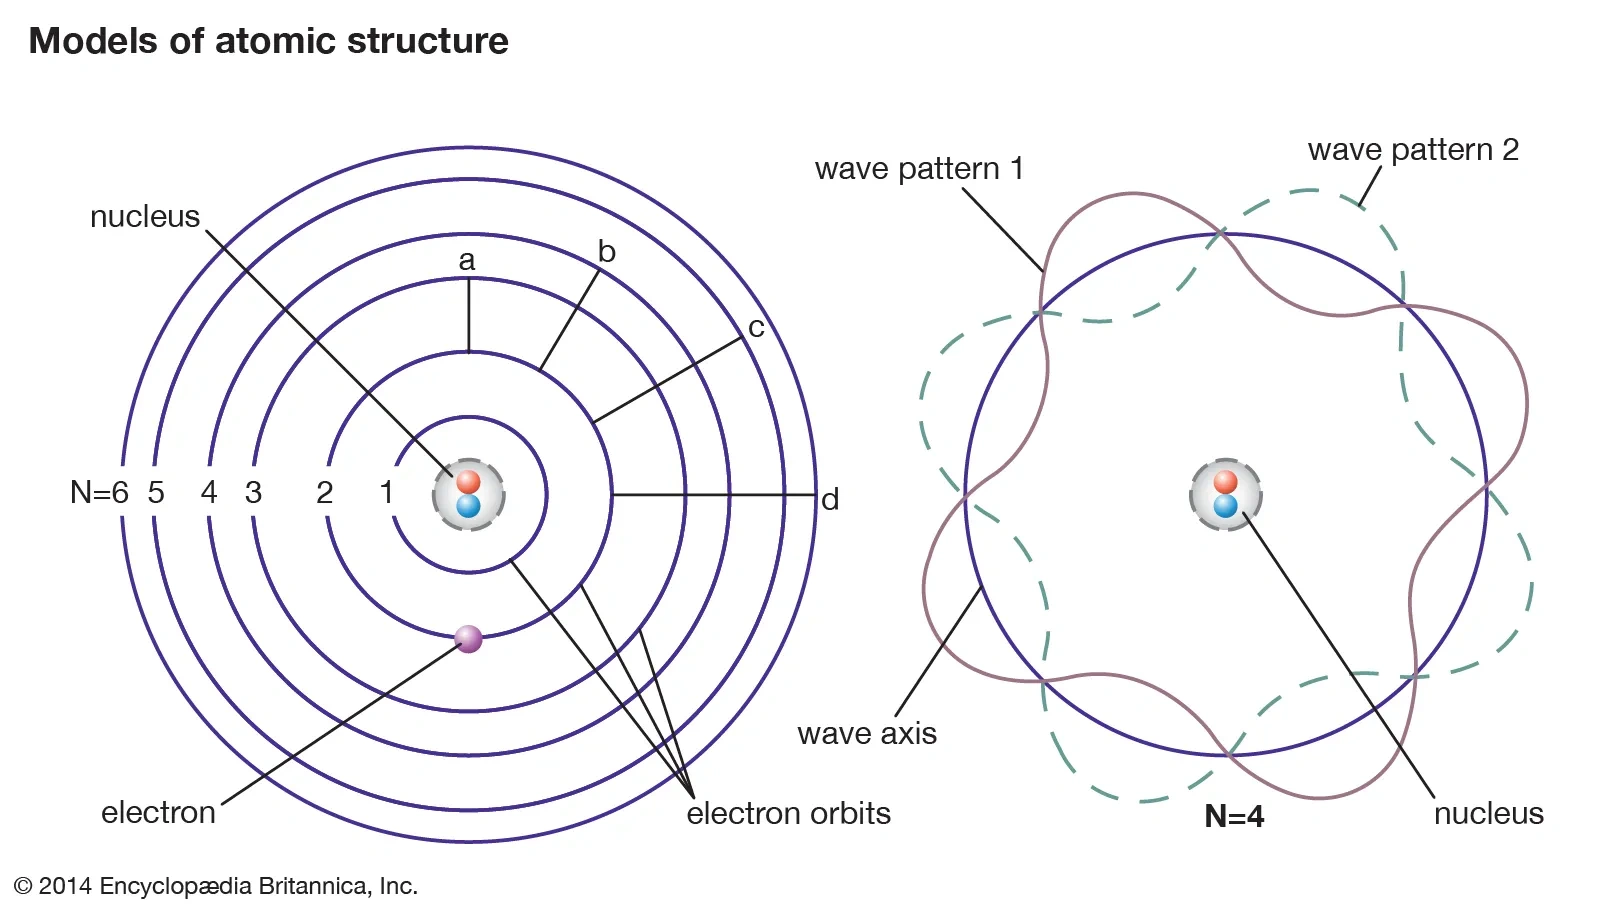 |
535 KB | Cabenshire fr (talk | contribs) | |
| 19:06, 26 February 2024 | Atom-quantum mechanics image.png (file) | 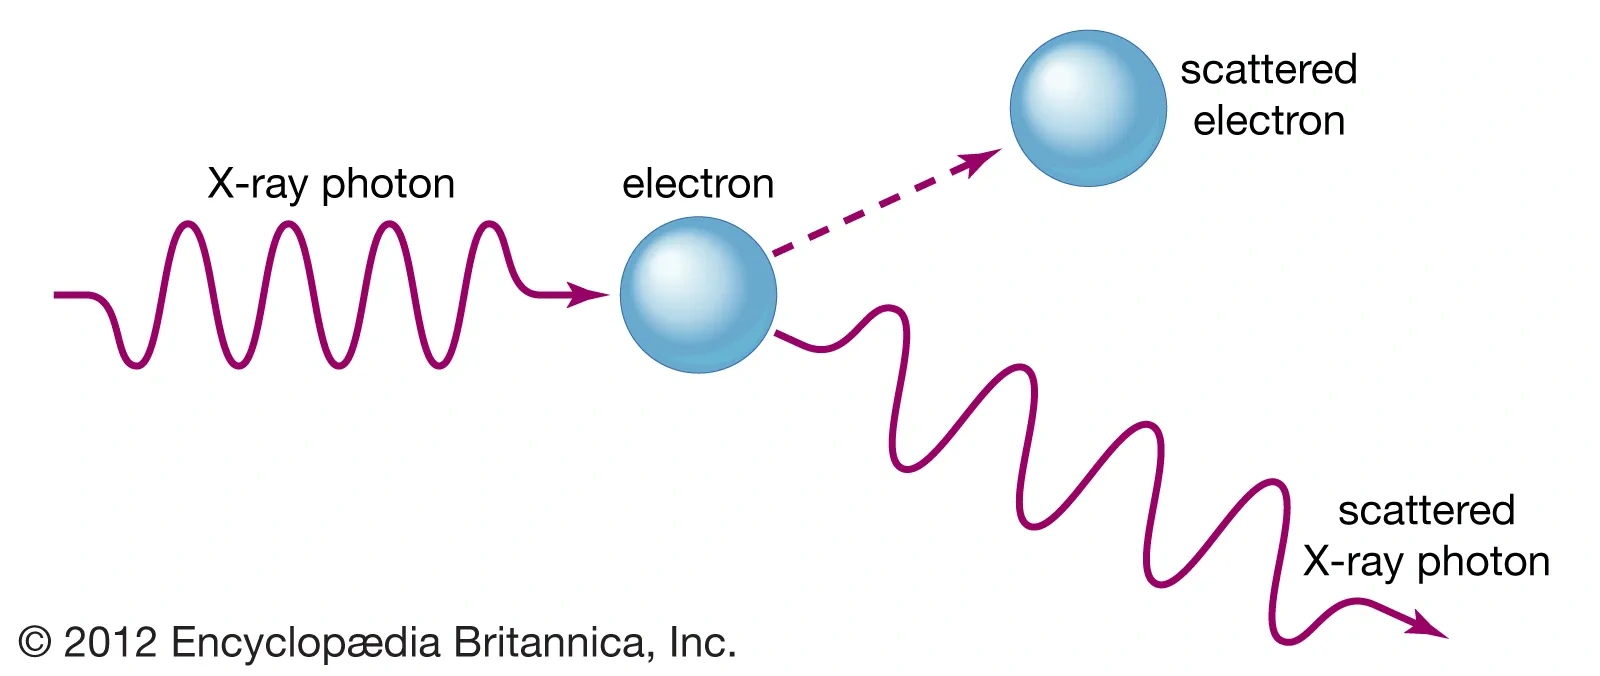 |
286 KB | Cabenshire fr (talk | contribs) | |
| 18:46, 26 February 2024 | Schrodinger Wave Function.jpg (file) | 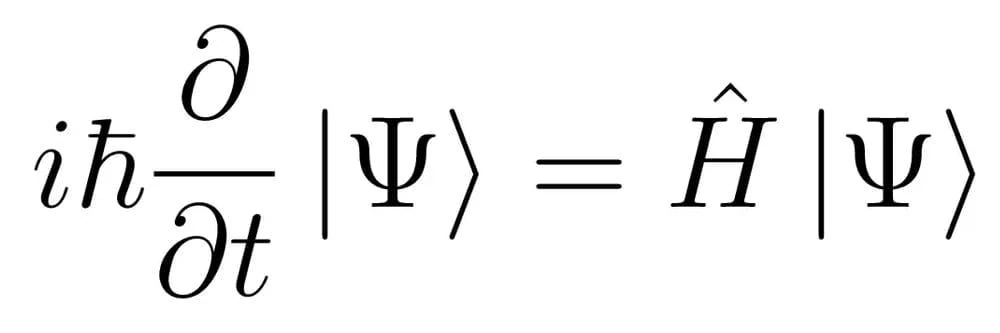 |
16 KB | Cabenshire fr (talk | contribs) | |
| 18:37, 26 February 2024 | Wave function equation.png (file) | 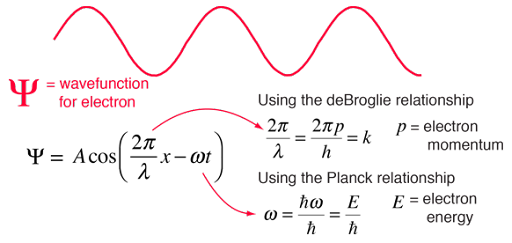 |
42 KB | Cabenshire fr (talk | contribs) | |
| 16:49, 12 November 2021 | Capture.png (file) |  |
8 KB | AdityaSingh7777 (talk | contribs) | |
| 12:37, 19 July 2021 | Site-background-dark (file) | 287 KB | FANDOMbot (talk | contribs) | ||
| 12:37, 19 July 2021 | Site-favicon.ico (file) | 40 KB | FANDOMbot (talk | contribs) | ||
| 12:37, 19 July 2021 | Site-background-light (file) | 287 KB | FANDOMbot (talk | contribs) | ||
| 12:37, 19 July 2021 | Site-logo.png (file) | 26 KB | FANDOMbot (talk | contribs) | ||
| 00:00, 25 July 2020 | Laser.jpg (file) | 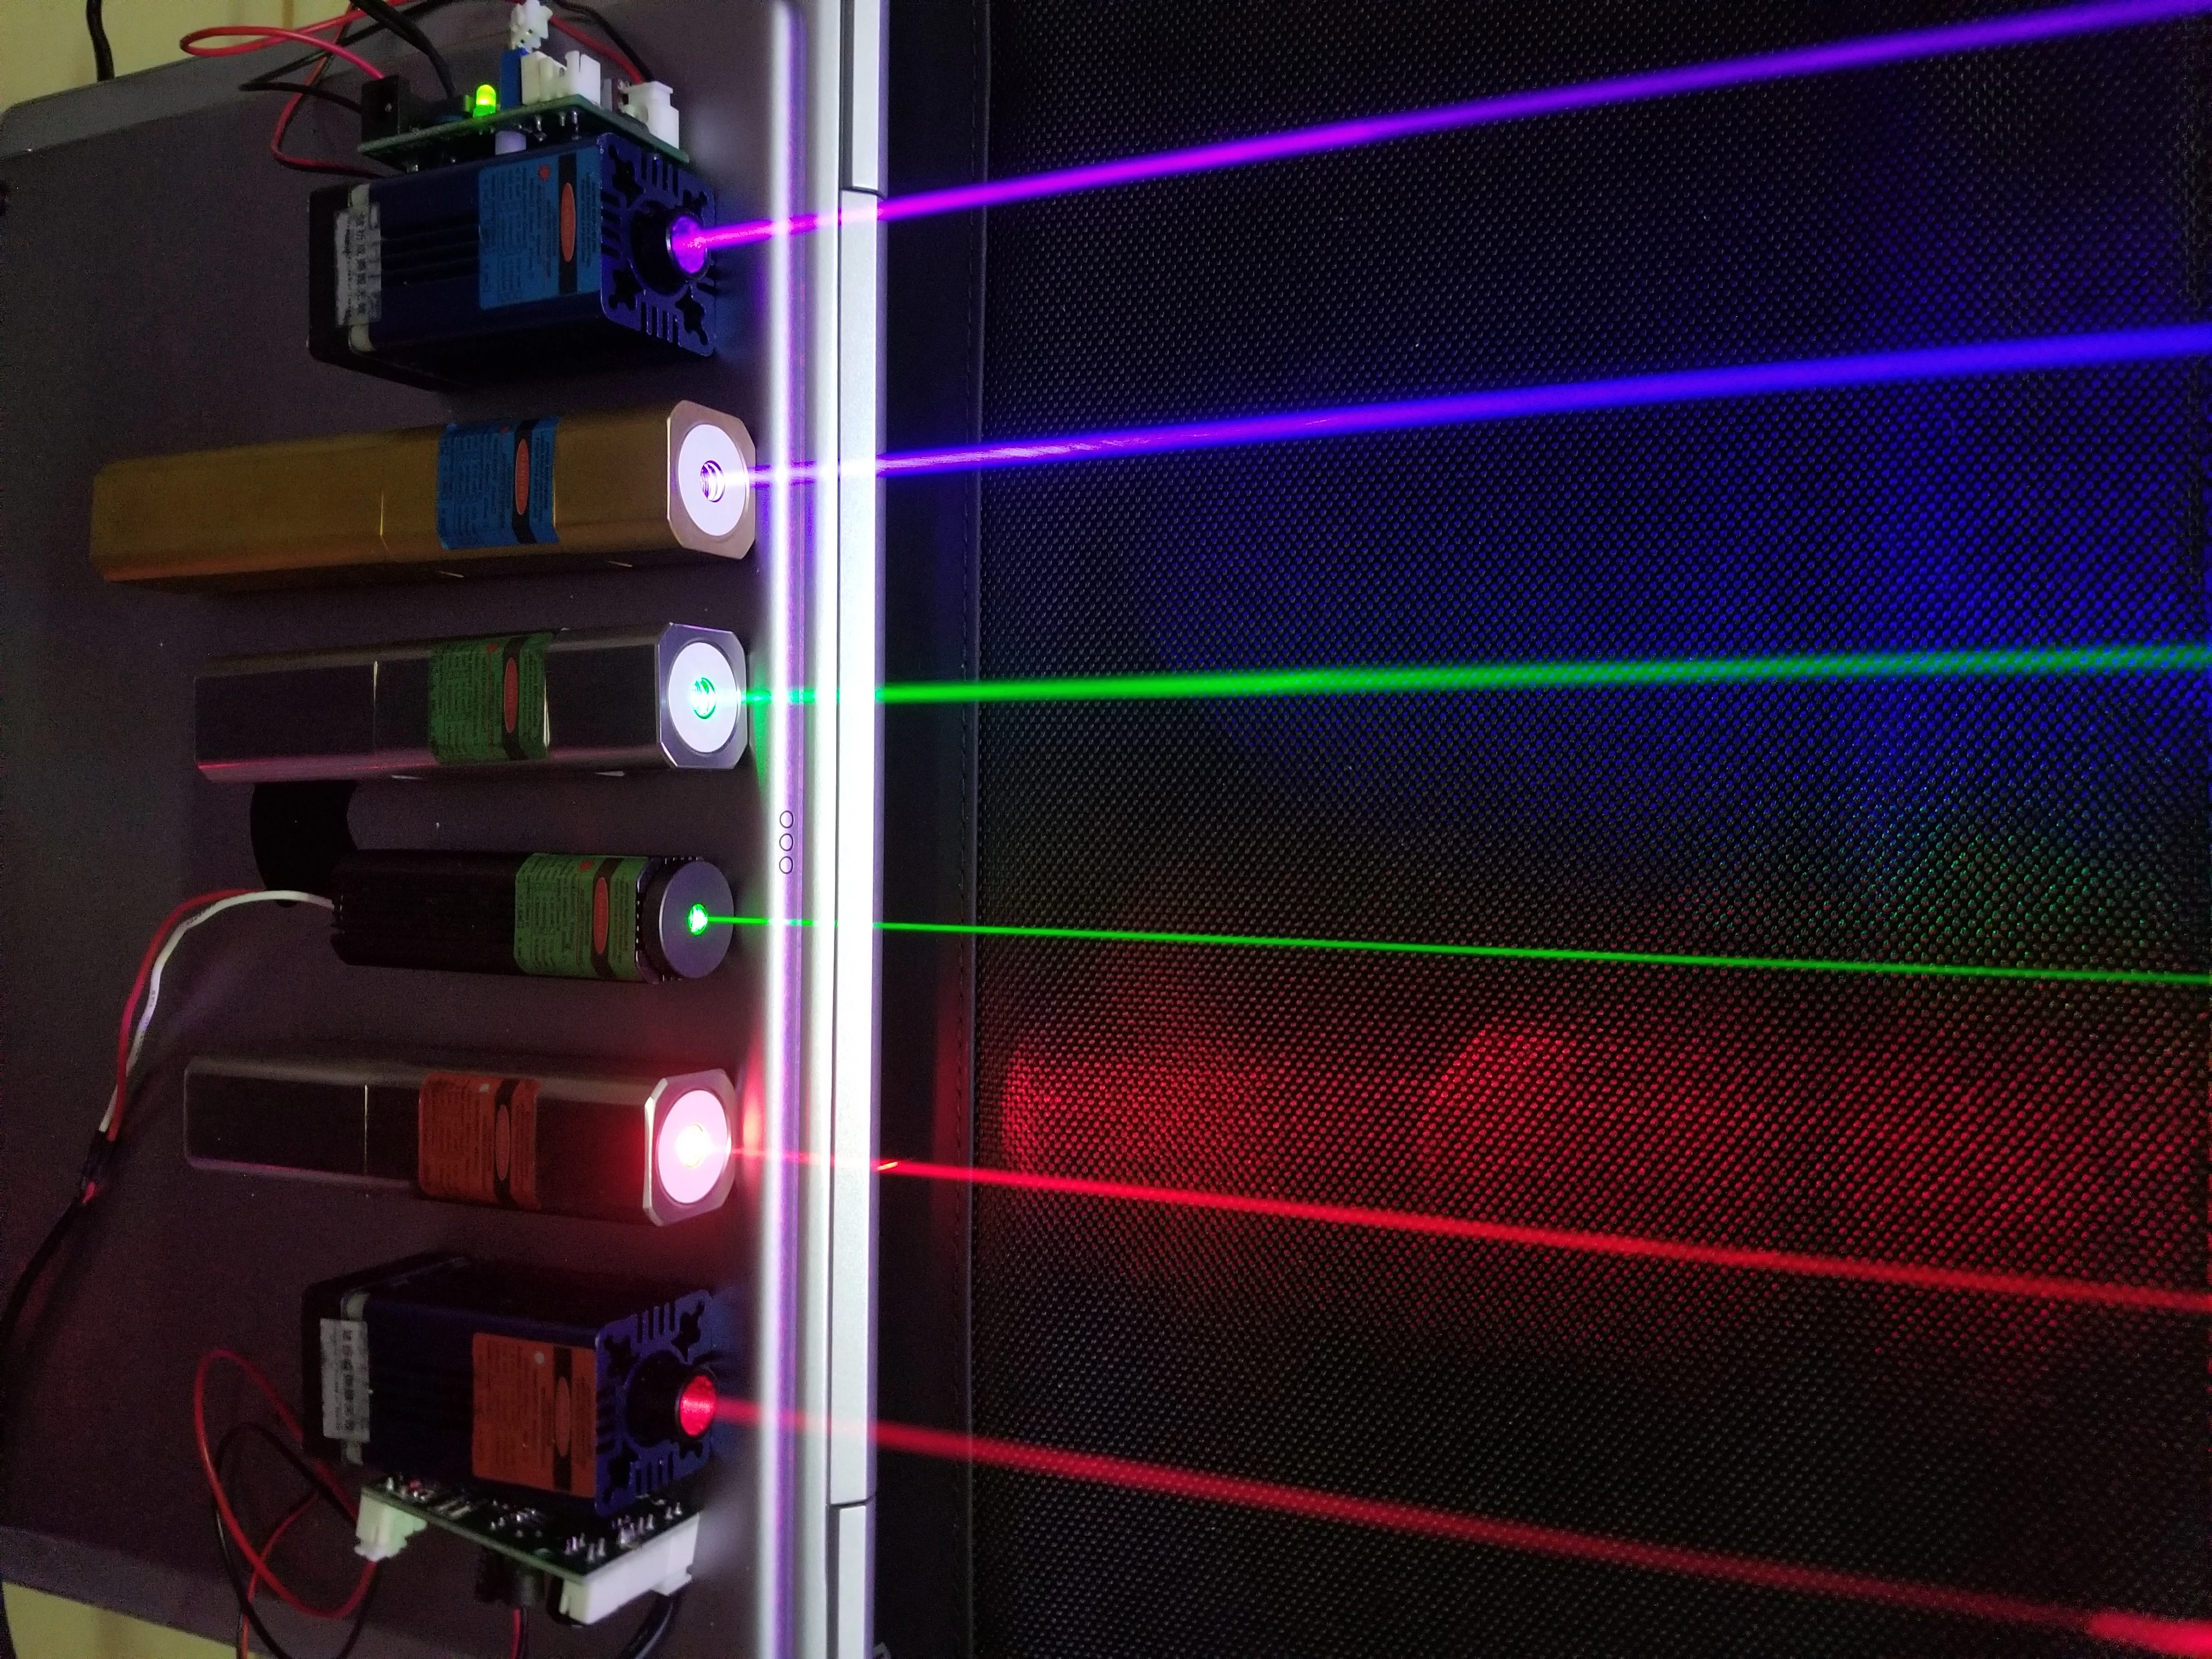 |
4.51 MB | 彭嘉傑 (talk | contribs) | *Red lasers: 635nm, 660nm *Green lasers: 520nm, 532nm *Blue lasers: 405nm, 445nm |
| 00:00, 25 July 2020 | Lasers.jpg (file) | 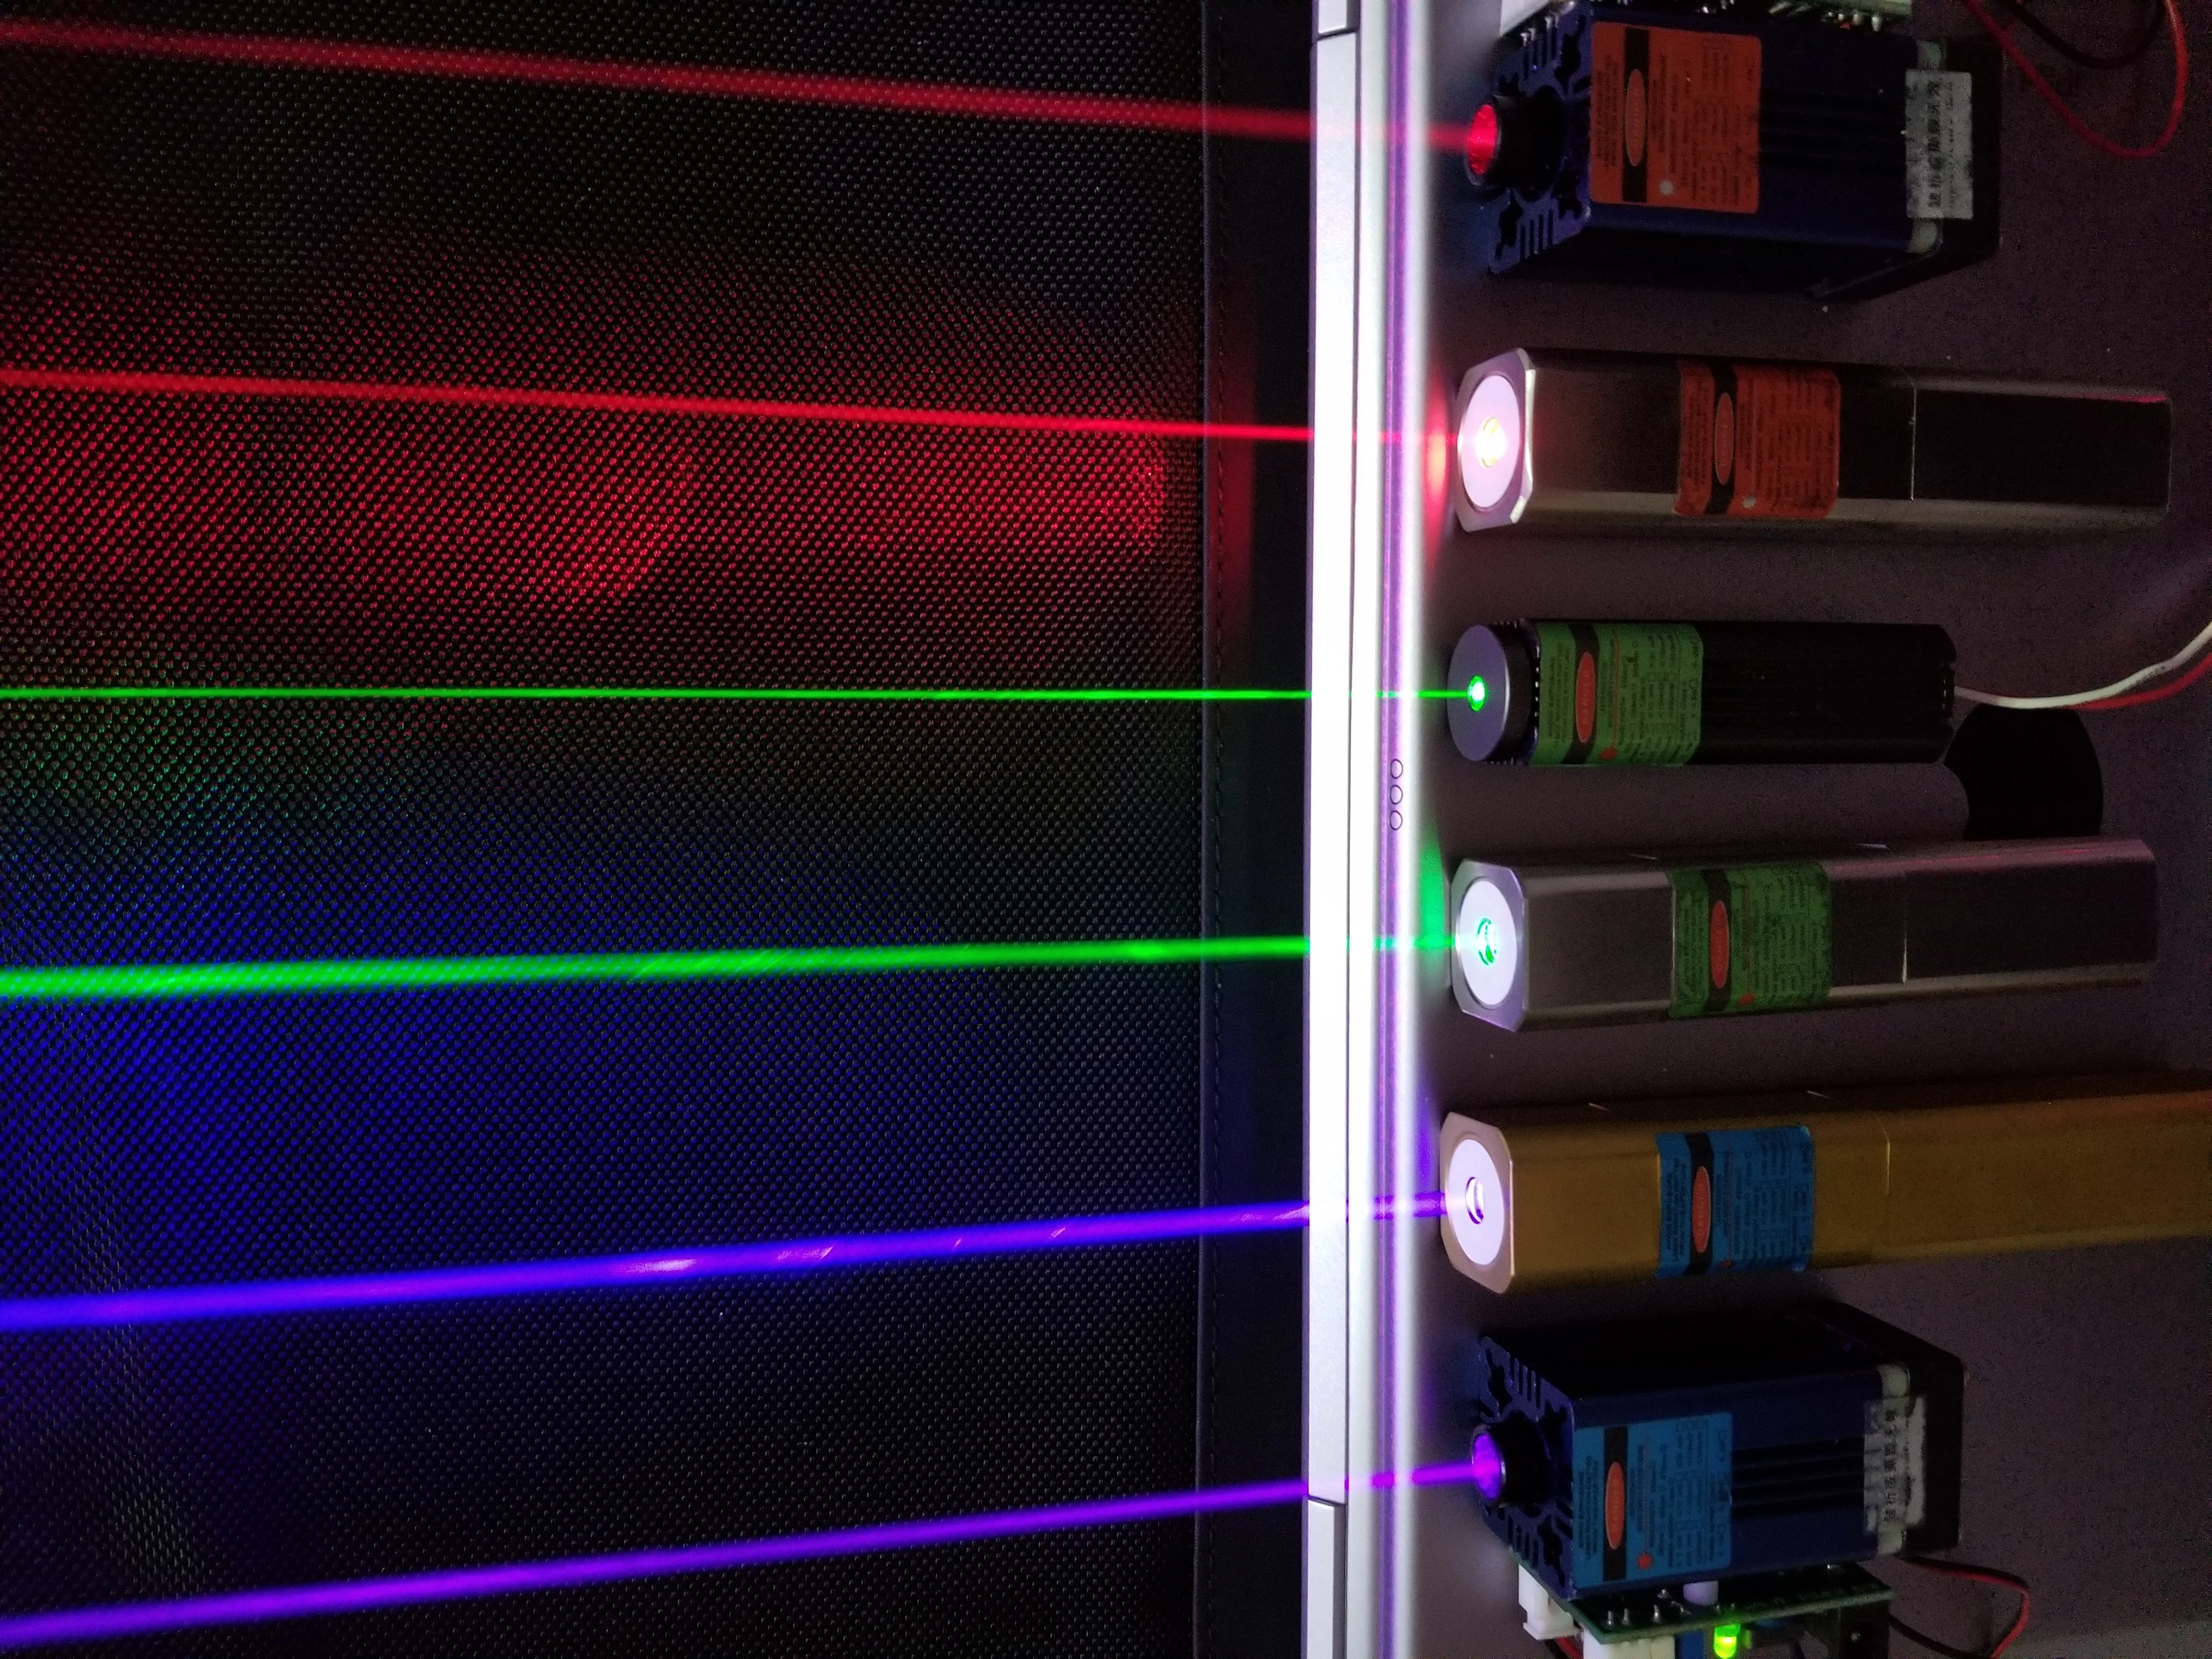 |
3.97 MB | 彭嘉傑 (talk | contribs) | *Red lasers: 635nm, 660nm *Green lasers: 520nm, 532nm *Blue lasers: 405nm, 445nm |
| 00:00, 25 July 2020 | Laser Pointer.jpg (file) | 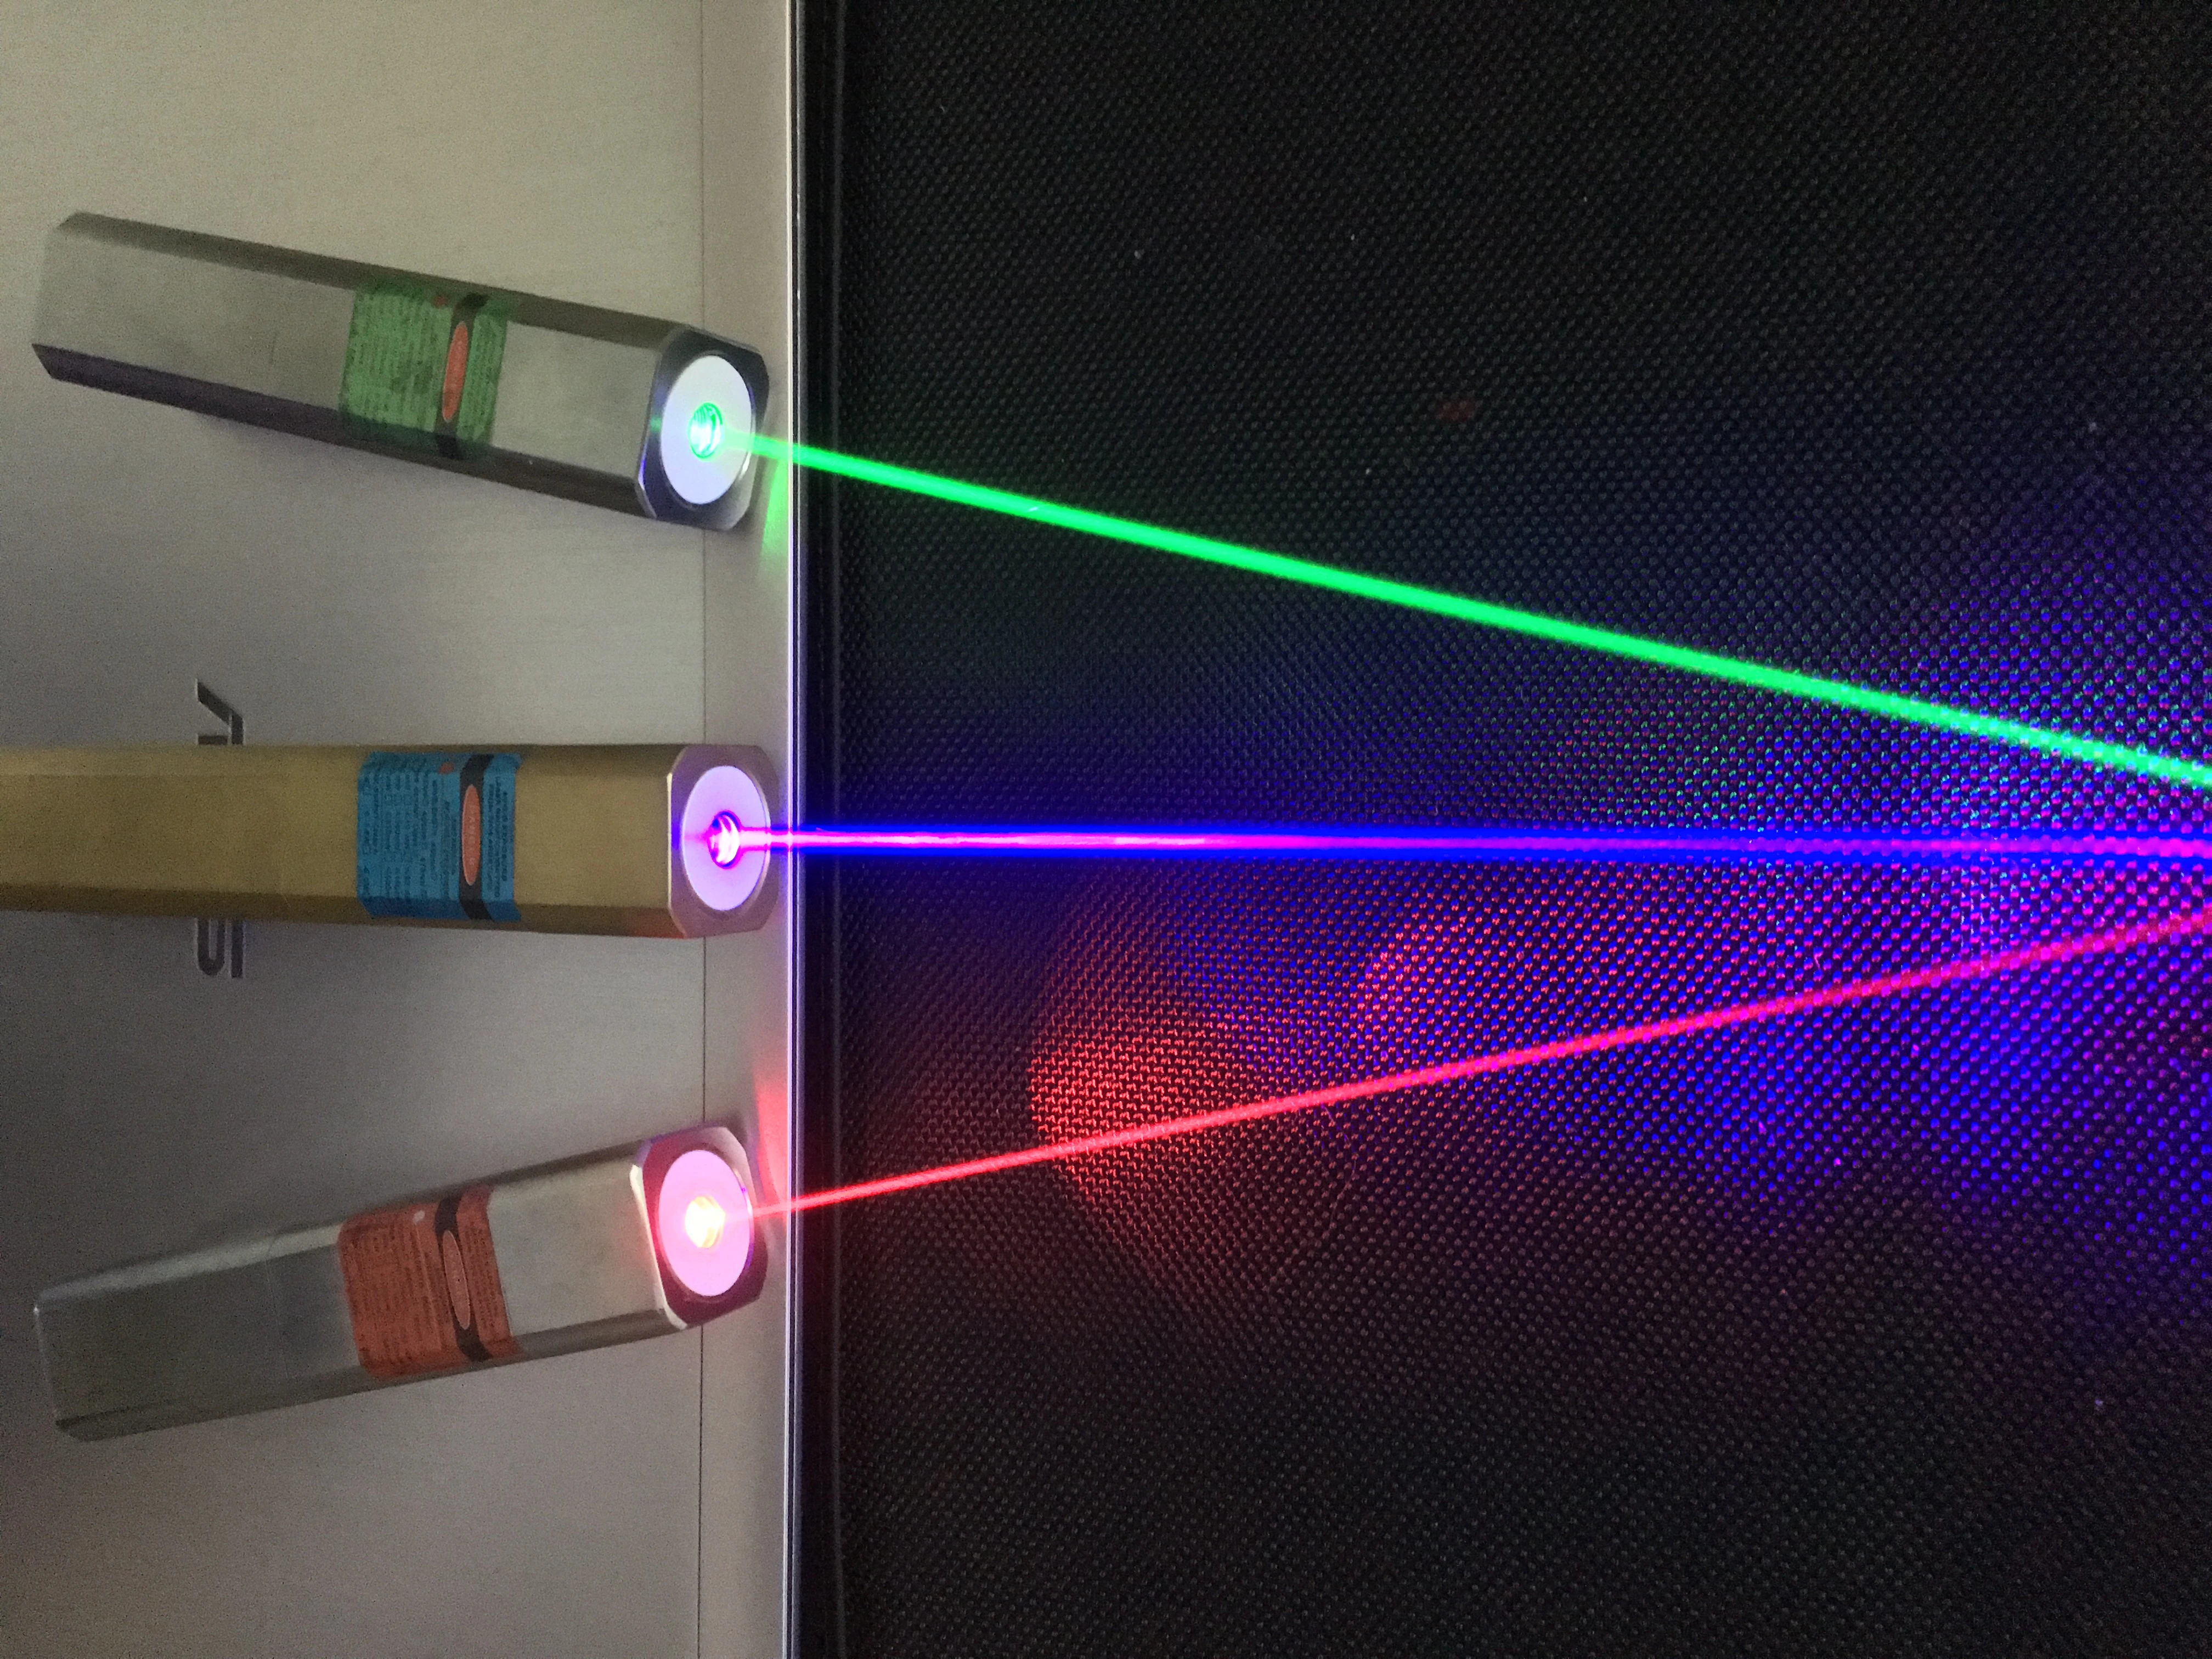 |
2.81 MB | 彭嘉傑 (talk | contribs) | * Green Laser: wavelength 520nm * Blue Laser: wavelength 445nm * Red Laser: wavelength 635nm |
| 00:00, 25 July 2020 | Laser Pointers.jpg (file) | 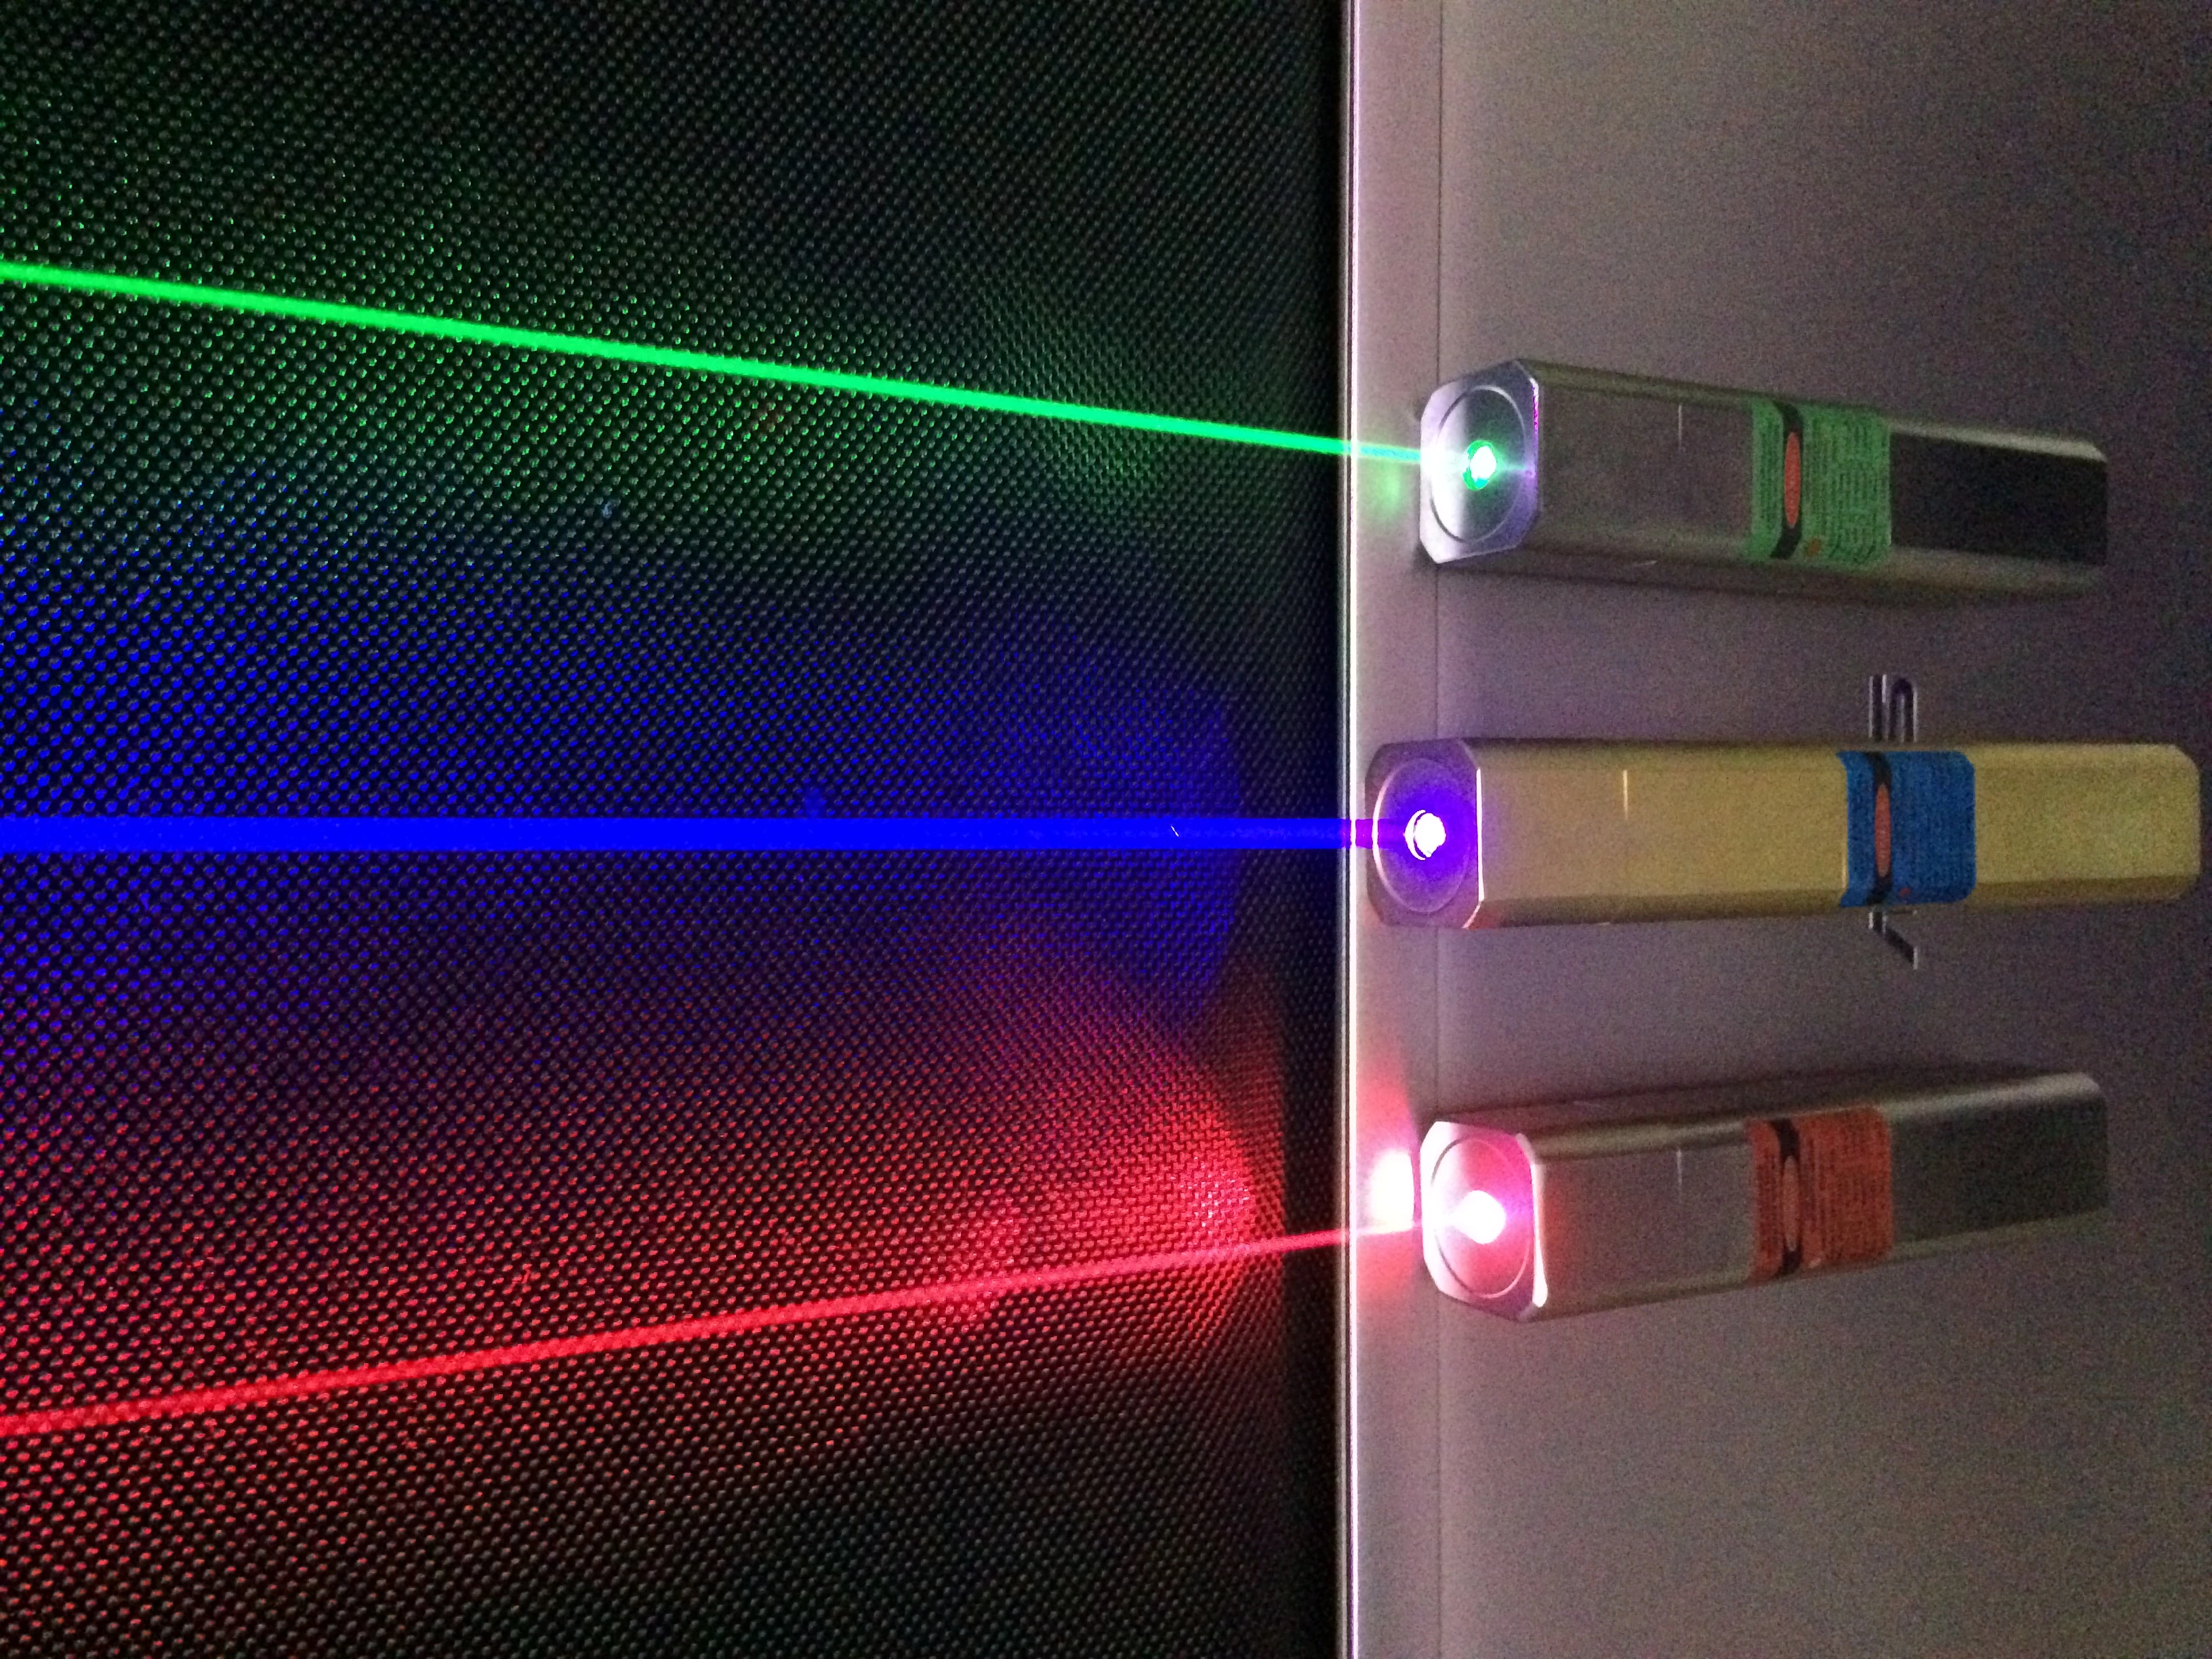 |
3.24 MB | 彭嘉傑 (talk | contribs) | * Green Laser: wavelength 520nm * Blue Laser: wavelength 445nm * Red Laser: wavelength 635nm |
| 20:29, 13 May 2019 | Global precipitation.png (file) | 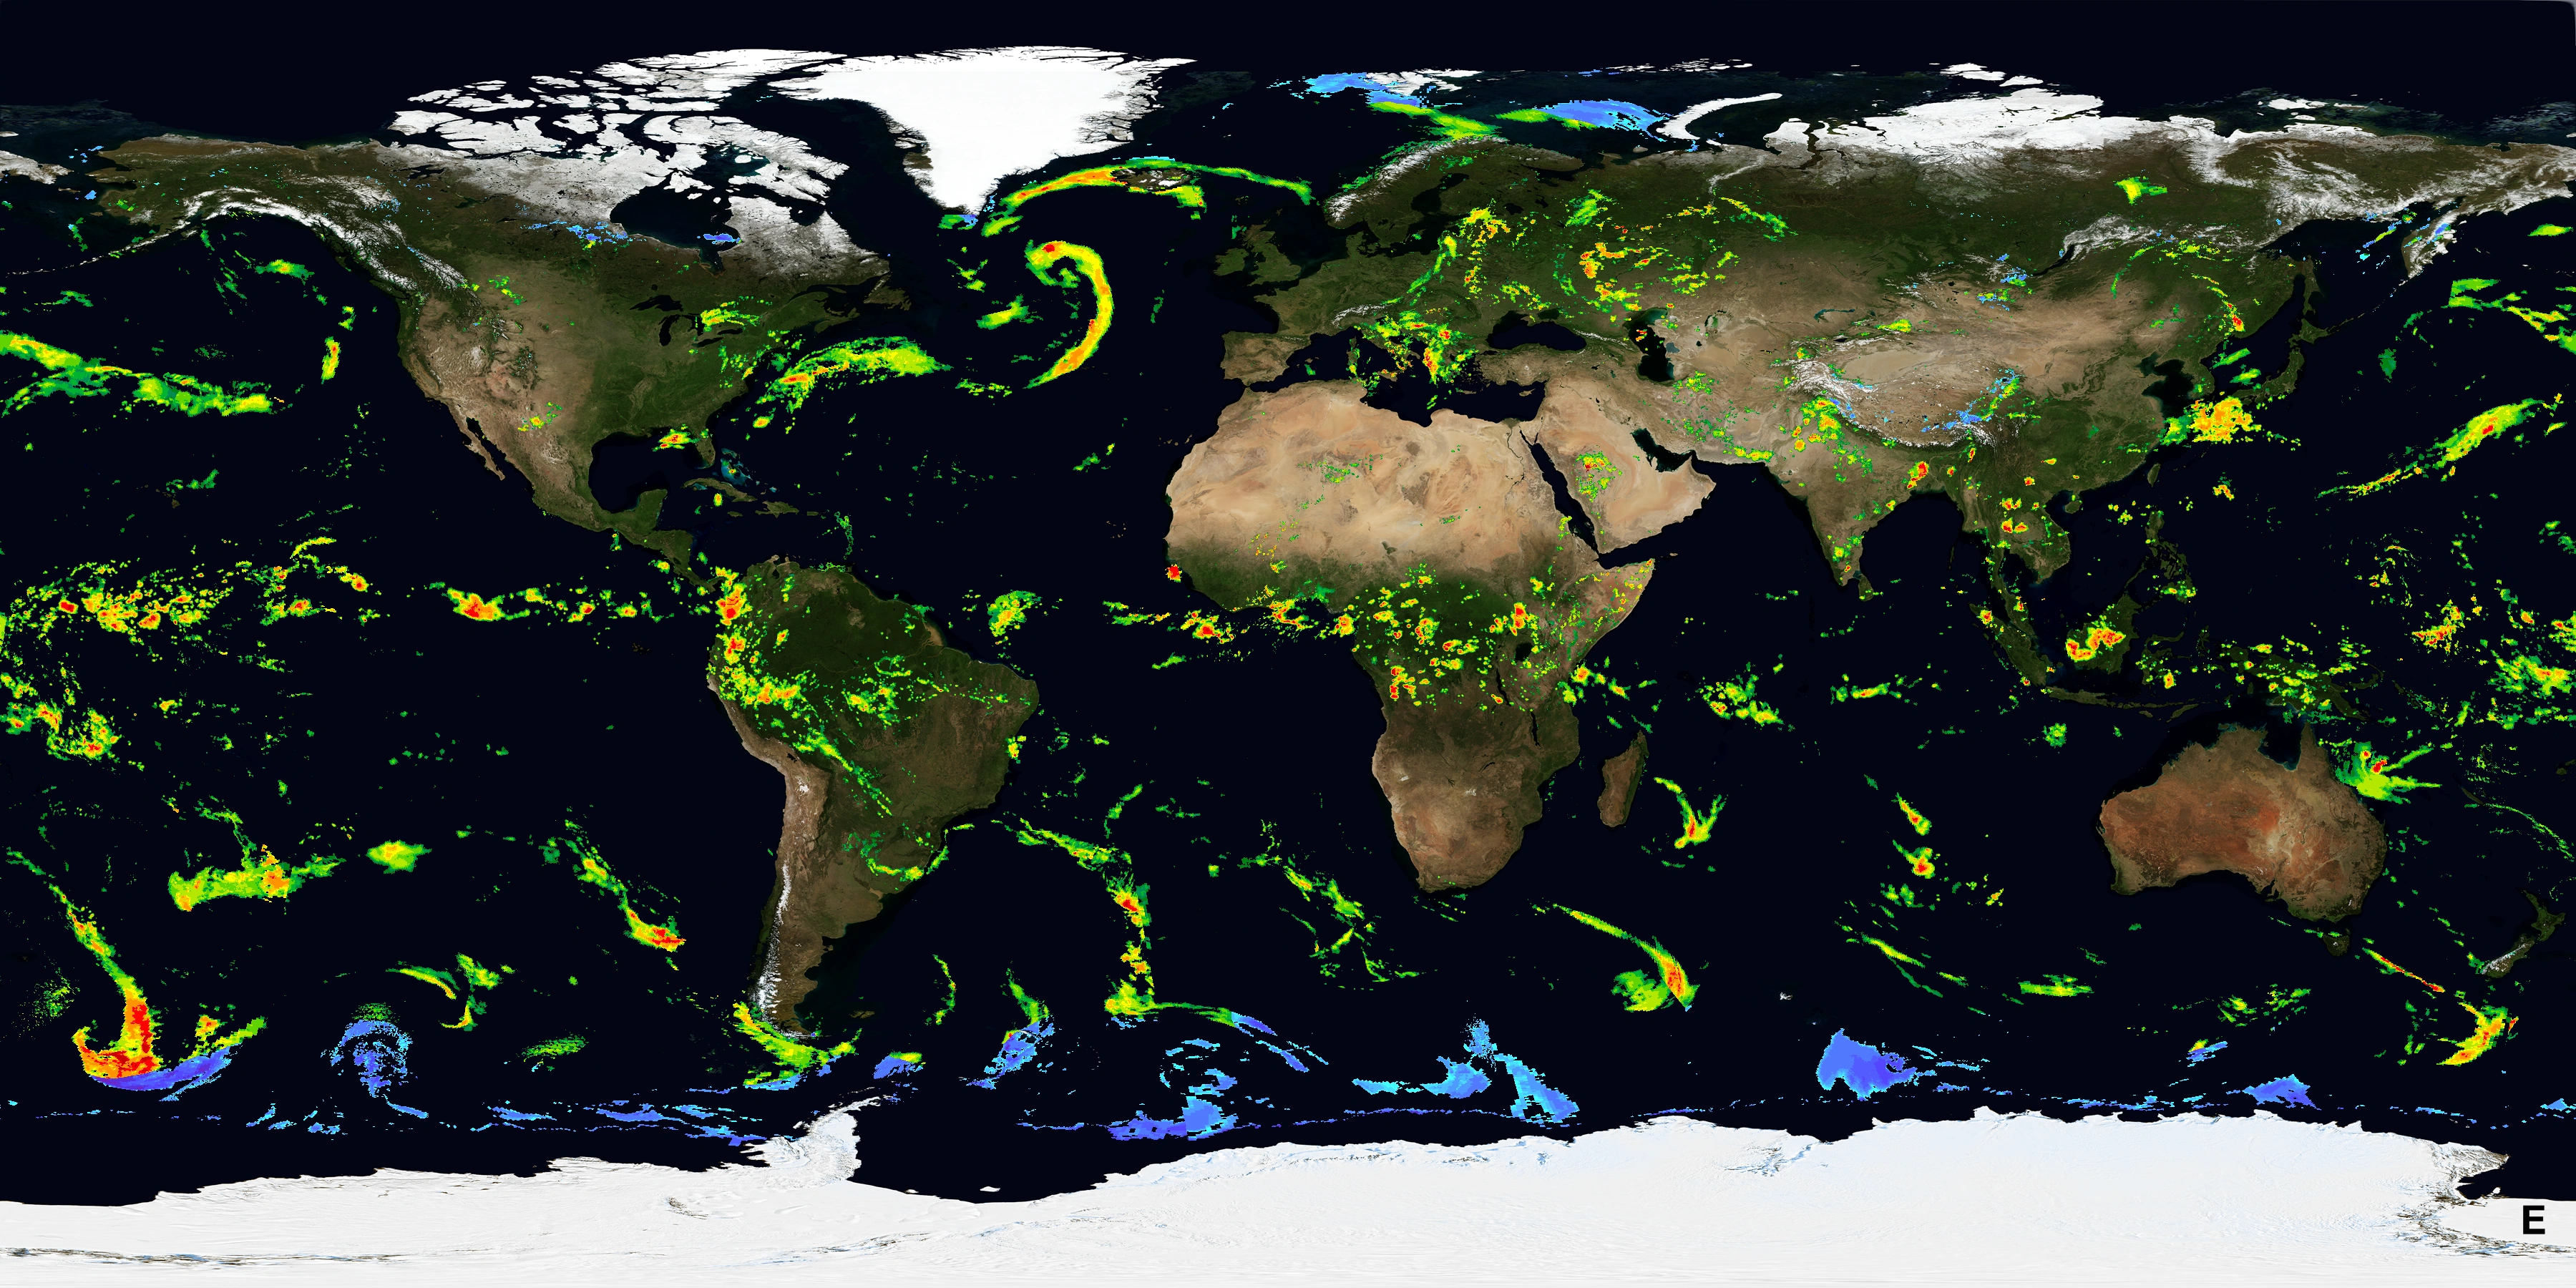 |
4.87 MB | Granpa (talk | contribs) | |
| 06:25, 5 May 2019 | Color star-en (tertiary names).svg (file) |  |
19 KB | Granpa (talk | contribs) | |
| 06:23, 5 May 2019 | RBG color wheel.svg (file) |  |
17 KB | Granpa (talk | contribs) | |
| 07:03, 1 May 2019 | BirdVisualPigmentSensitivity.svg (file) |  |
21 KB | Granpa (talk | contribs) | |
| 21:44, 9 April 2019 | Average wind (north-south).gif (file) | 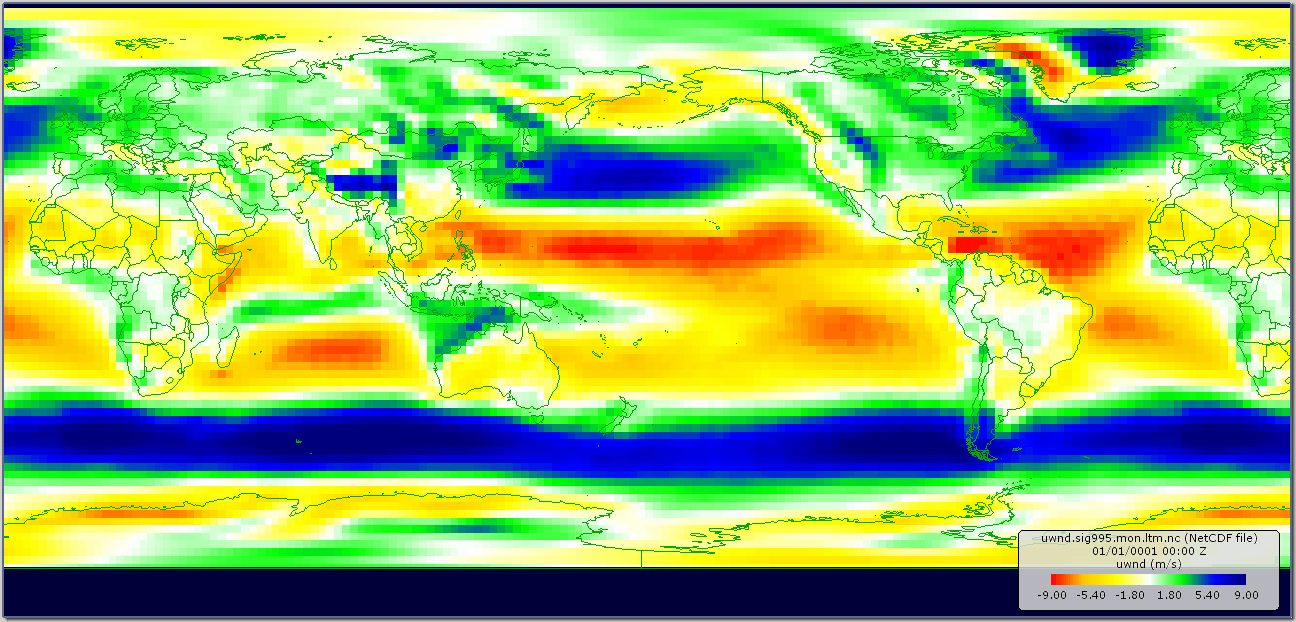 |
1.99 MB | Granpa (talk | contribs) | |
| 20:40, 9 April 2019 | Average sea level air pressure.gif (file) | 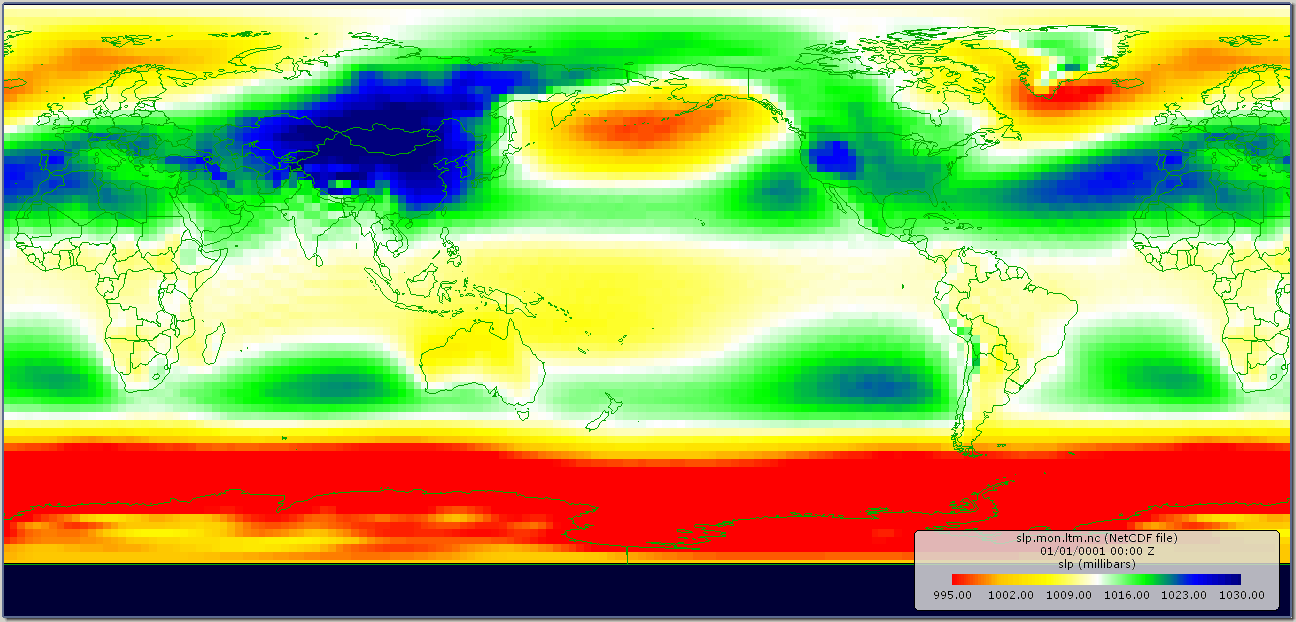 |
1.64 MB | Granpa (talk | contribs) | From NOAA. https://www.esrl.noaa.gov/psd/data/gridded/data.ncep.reanalysis.derived.surface.html Sea Level Pressure Monthly Long Term Means Sea Level slp.mon.ltm.nc |
| 15:19, 8 April 2019 | ITCZ january-july.png (file) | 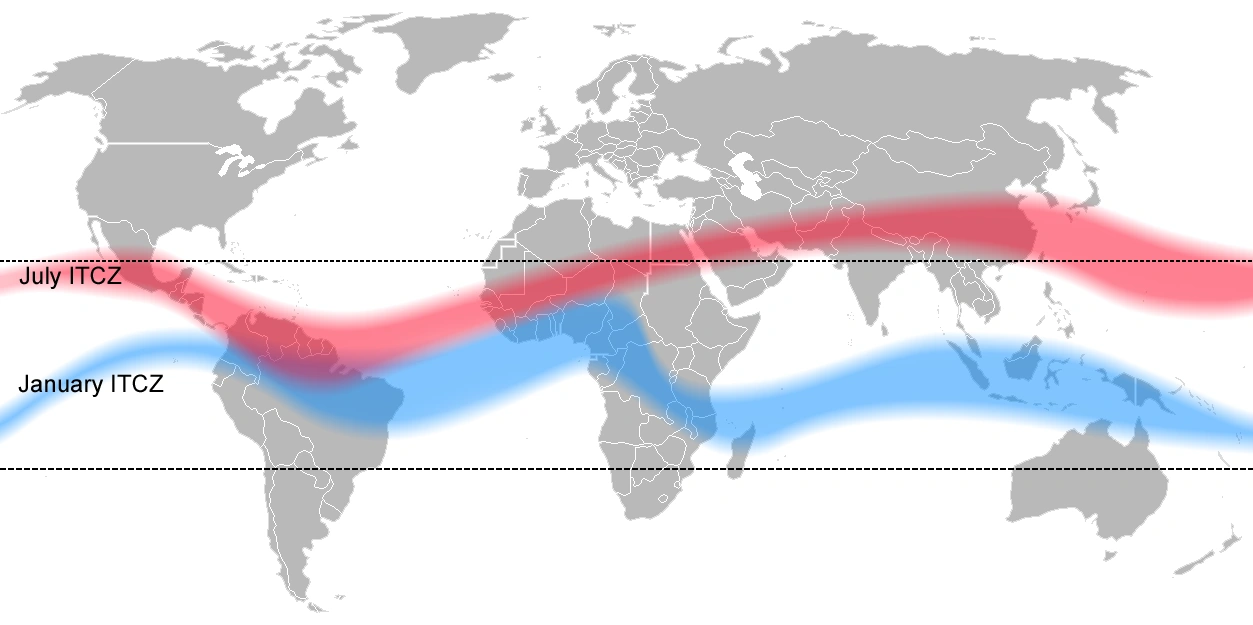 |
159 KB | Granpa (talk | contribs) | |
| 11:58, 7 April 2019 | Air masses.svg (file) |  |
686 KB | Granpa (talk | contribs) | |
| 09:38, 5 April 2019 | Jetstreamconfig.jpg (file) | 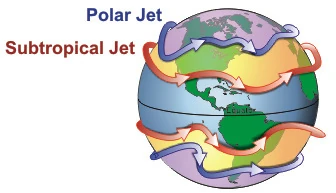 |
29 KB | Granpa (talk | contribs) | jet stream configuration |
| 17:26, 3 April 2019 | Atmospheric Transmission.png (file) | 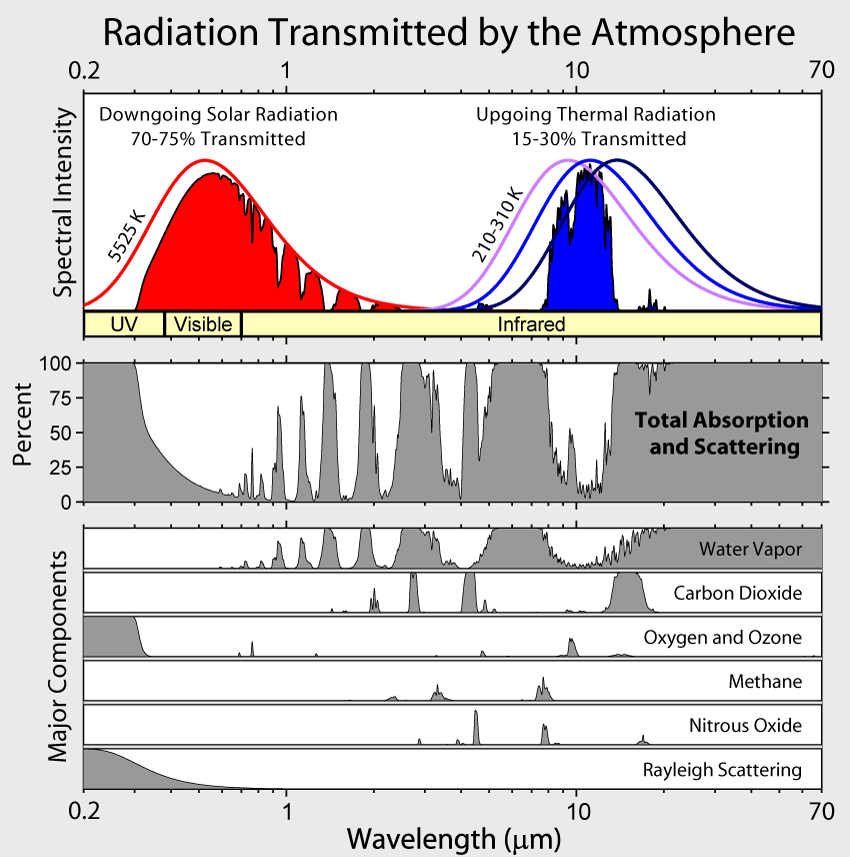 |
75 KB | Granpa (talk | contribs) | |
| 15:47, 3 April 2019 | Occluded front.png (file) | 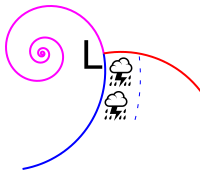 |
6 KB | Granpa (talk | contribs) | |
| 08:04, 3 April 2019 | Polar front.png (file) | 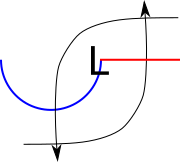 |
4 KB | Granpa (talk | contribs) | Polar front with low pressure area. Public domain. {{PD}} |
| 05:15, 3 April 2019 | RankineVortex.svg (file) |  |
37 KB | Granpa (talk | contribs) | Velocity distribution in a Rankine vortex. |
| 12:43, 2 April 2019 | Bomb cyclone.gif (file) |  |
41 KB | Granpa (talk | contribs) | From the NWS |
| 11:16, 2 April 2019 | Mslp-jja-djf.png (file) | 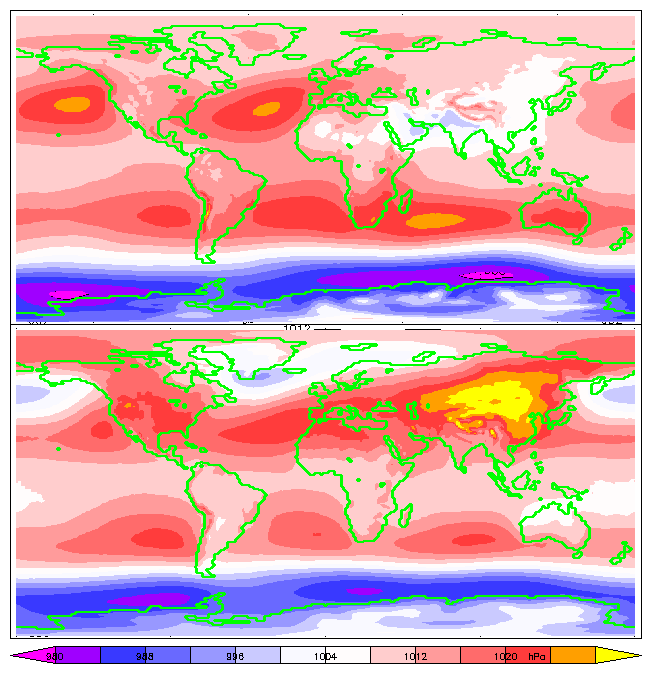 |
24 KB | Granpa (talk | contribs) | en:Mean sea level pressure for JJA (June-July-August, top) and DJF (December-January-February, bottom) from the ERA-15 reanalysis |
| 06:33, 1 April 2019 | Supercell02.png (file) | 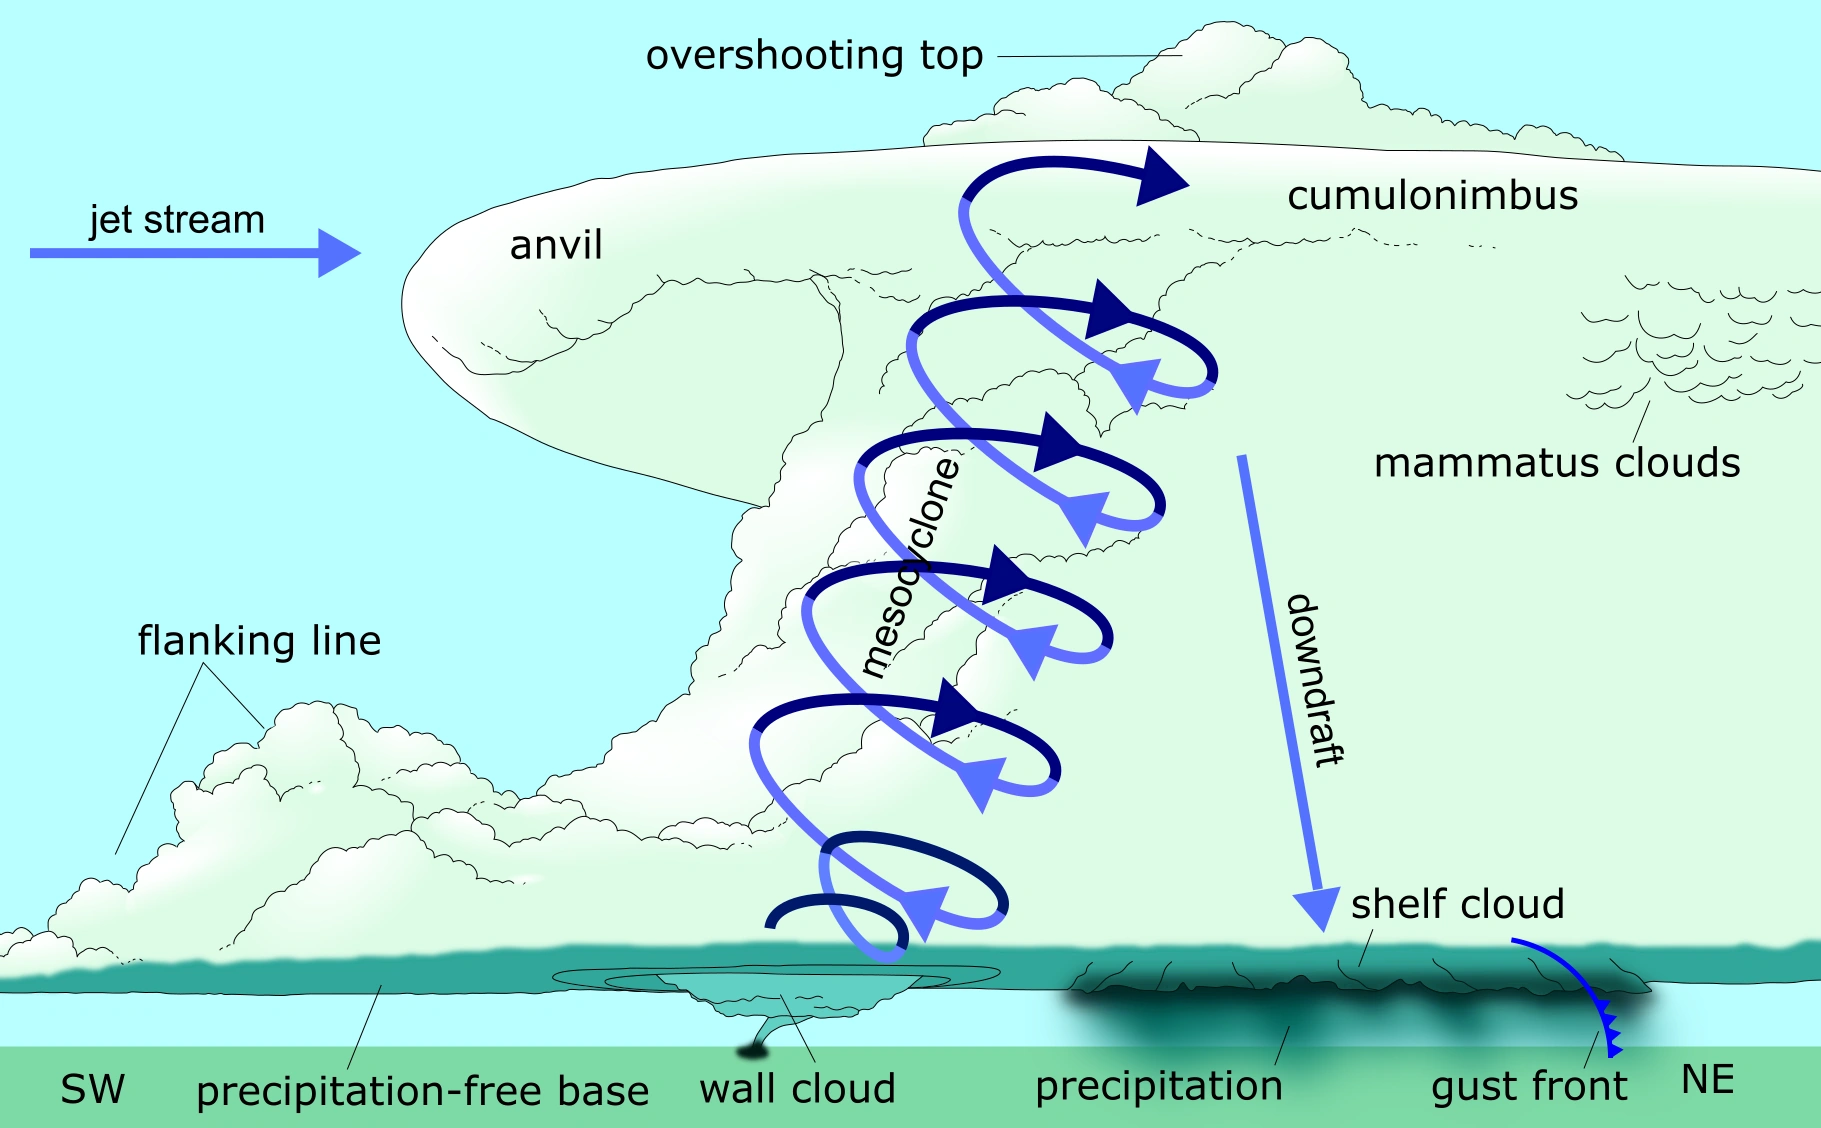 |
482 KB | Granpa (talk | contribs) | gust front |
| 01:23, 30 March 2019 | Atmospheric boundary layer.svg (file) |  |
110 KB | Granpa (talk | contribs) | |
| 22:57, 28 March 2019 | PDO Pattern.png (file) | 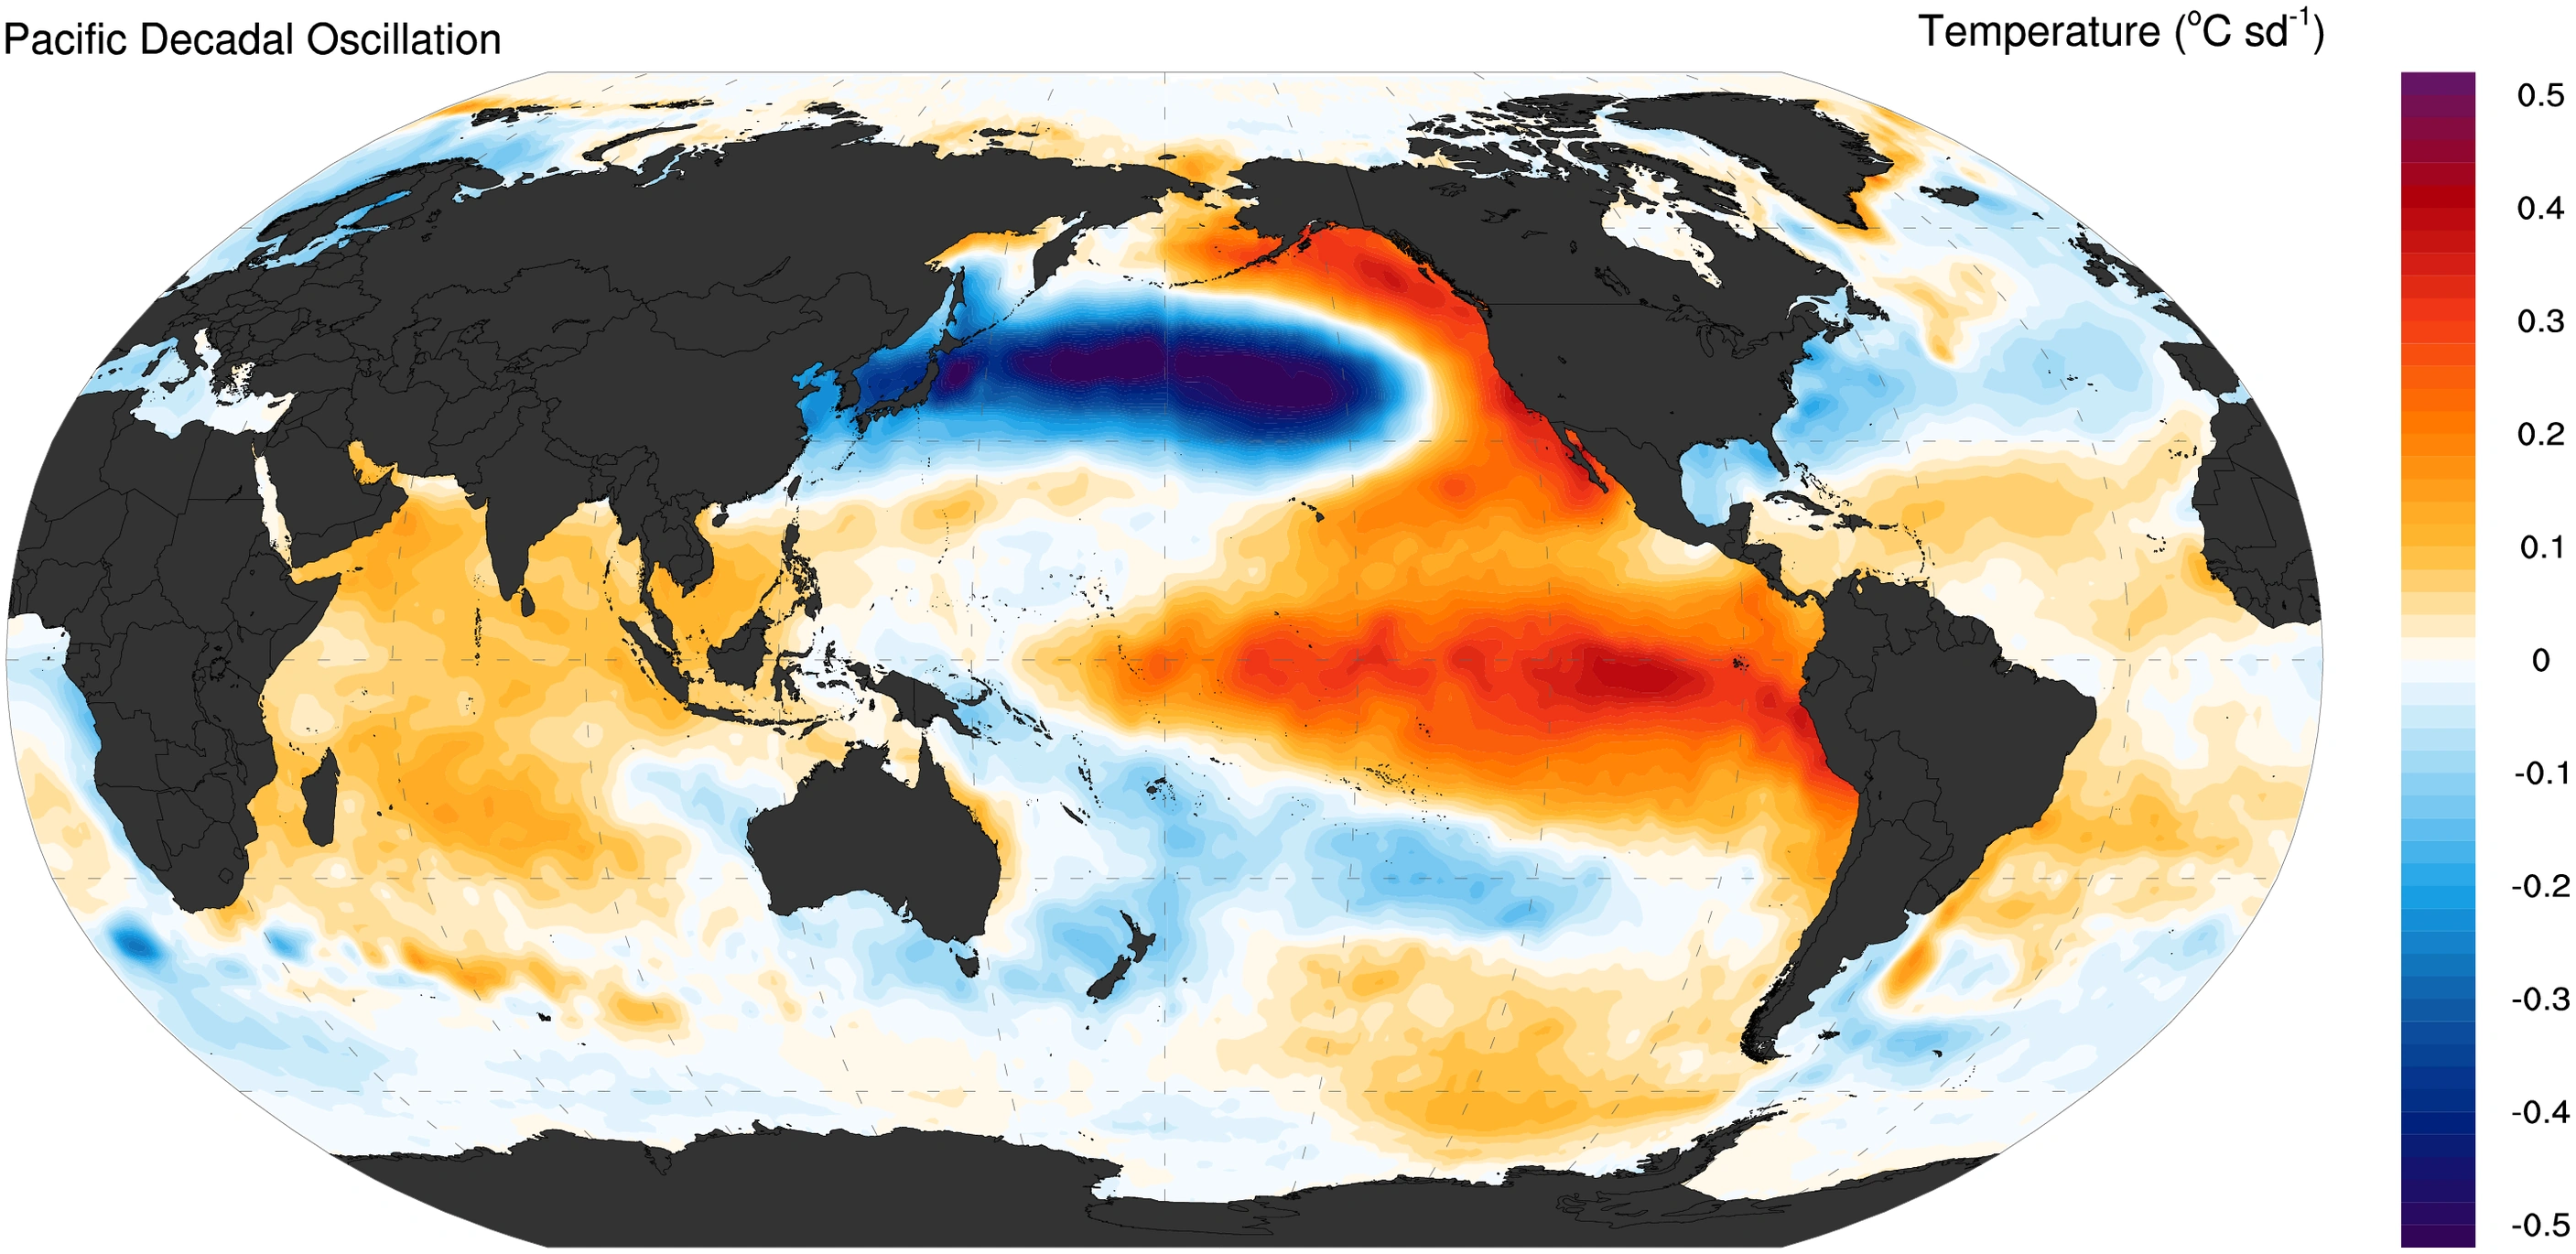 |
2.23 MB | Granpa (talk | contribs) | PDO global pattern. The PDO is the leading EOF of monthly sea surface temperature anomalies over the North Pacific after the global mean sea surface temperature anomaly is removed. The global pattern is computed as the regression of monthly sea surface... |
| 22:56, 28 March 2019 | North Pacific Oscillation.png (file) | 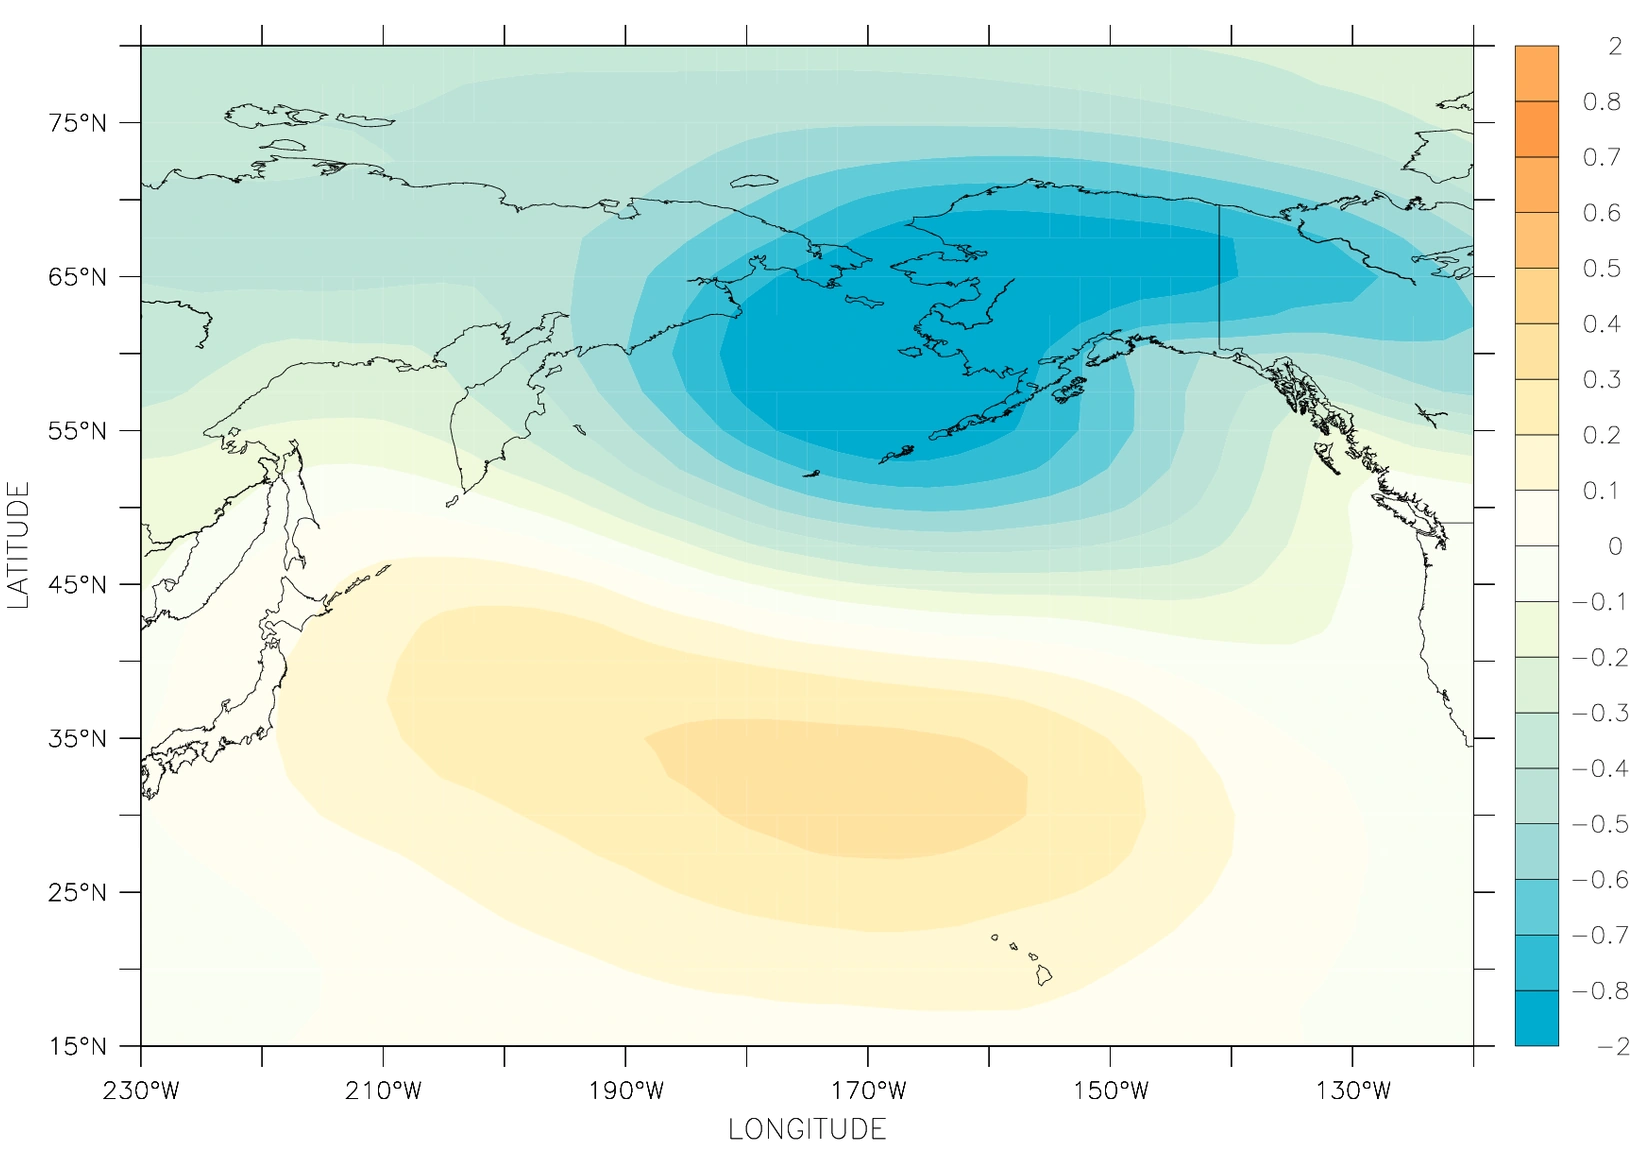 |
695 KB | Granpa (talk | contribs) | North Pacific Oscillation DJFM pattern obtained as the second EOF of NCEP/NCAR slp over the North Pacific |
| 21:26, 28 March 2019 | Occluded cyclone.svg (file) |  |
21 KB | Granpa (talk | contribs) | Occluded cyclone, National Weather Service Southern Region |
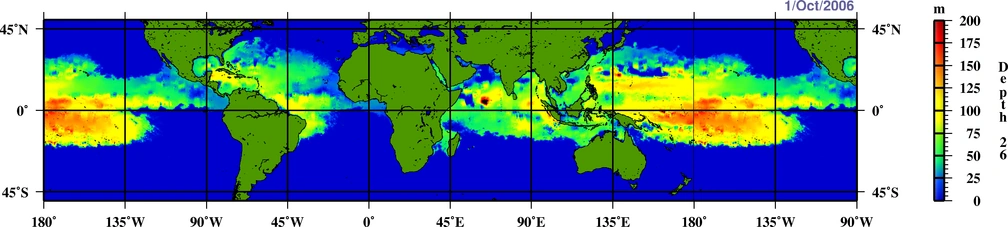
| 20:52, 27 March 2019 | Depth26Cisotherm.png (file) | 186 KB | Granpa (talk | contribs) | Depth of 26 °C isotherm on October 1, 2006 | |
| 18:16, 27 March 2019 | Meteorology thermodynamic en.svg (file) |  |
13 KB | Granpa (talk | contribs) | Diagram showing the path of a convective parcel of moist air. It becomes satured when it reaches the Level of Condensation by Lifting (LCL) and reaches instability at the Level of Free Convection (LFC) when its temperature (T) becomes greater than the ... |
| 16:14, 26 March 2019 | Lee Ranch Wind Speed Frequency.svg (file) |  |
54 KB | Granpa (talk | contribs) | Distribution of wind speed (red) and energy generated (blue) for all of 2002 at the Lee Ranch facility in Colorado. The histogram shows measured data, while the curve is the Raleigh model distribution for the same average wind speed. |
| 15:31, 26 March 2019 | Phases of the Sun (NHemi).png (file) | 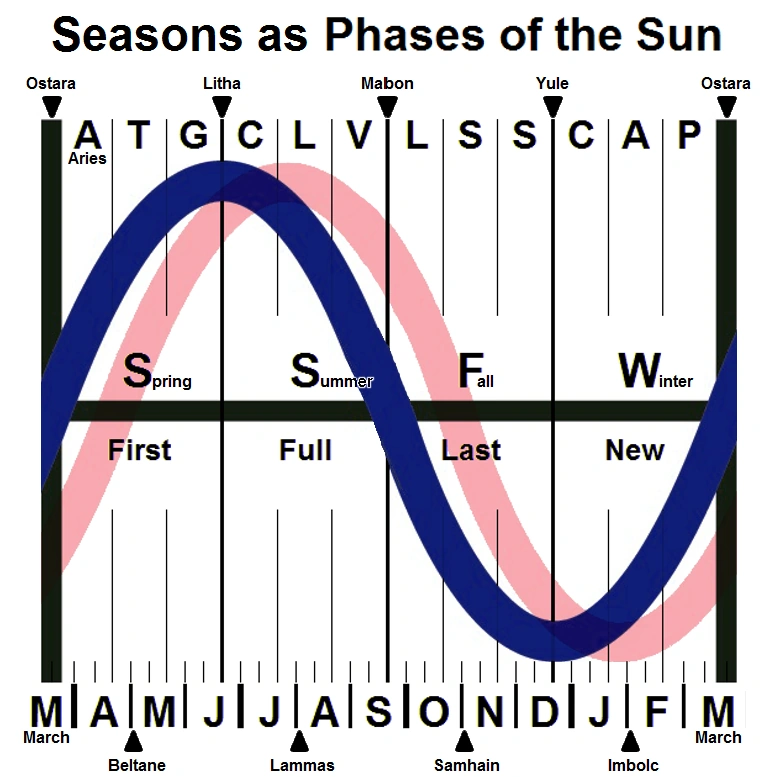 |
245 KB | Granpa (talk | contribs) | |
| 05:19, 16 March 2019 | Precipitation longterm mean.gif (file) | 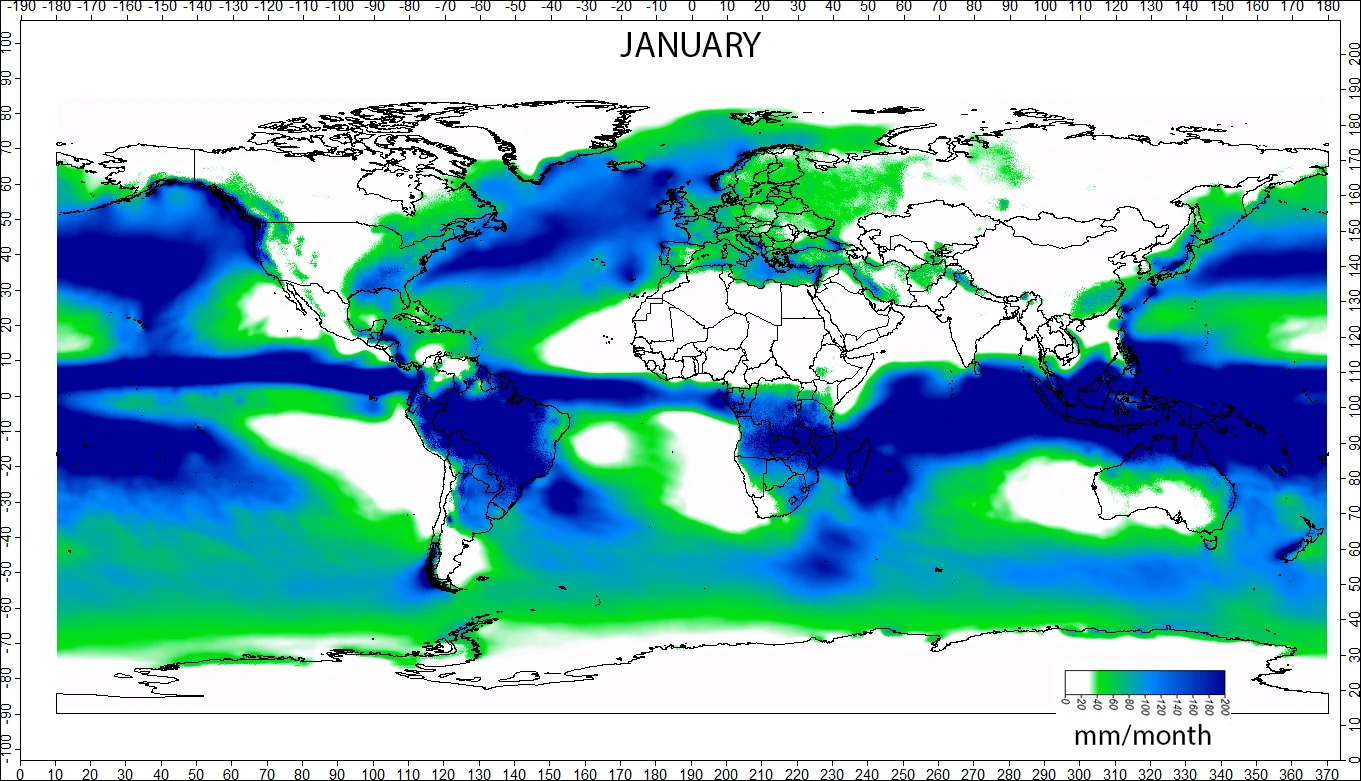 |
3.75 MB | Granpa (talk | contribs) | {{Information |description={{en|1=Long-term mean precipitation by month}} |date=2016-08-08 |source={{own}} |author=Greenmind1980 }} |
| 07:12, 16 January 2019 | 1851-2017 Atlantic hurricanes and tropical storms by month.png (file) |  |
75 KB | Granpa (talk | contribs) | Graph of tropical storm and hurricane frequency, Atlantic region, monthly, based on data from 1851-2017. |
| 15:41, 23 December 2018 | Hqdefault.jpg (file) |  |
16 KB | Kaliambos (talk | contribs) |
.svg)
.gif)
.png)